VictorysharesUs CSB full analysis,charts,indicators,moving averages,SMA,DMA,EMA,ADX,MACD,RSIVictoryshares Us CSB WideScreen charts, DMA,SMA,EMA technical analysis, forecast prediction, by indicators ADX,MACD,RSI,CCI USA stock exchange
operates under N A sector & deals in N A
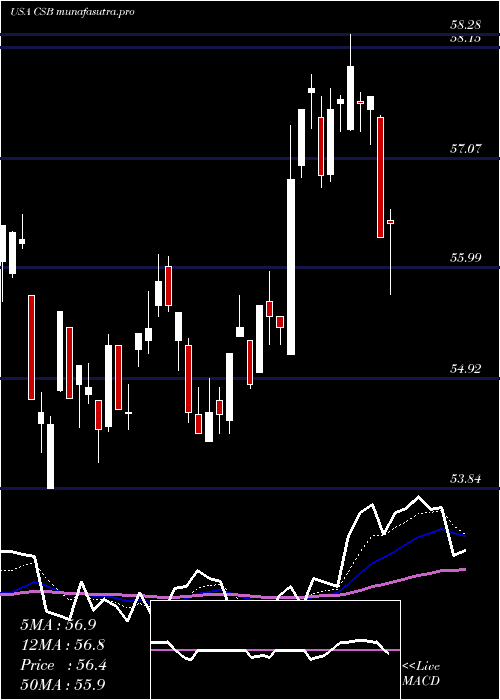
Daily price and charts and targets VictorysharesUs Strong Daily Stock price targets for VictorysharesUs CSB are 57.79 and 58.36 | Daily Target 1 | 57.33 | | Daily Target 2 | 57.68 | | Daily Target 3 | 57.896666666667 | | Daily Target 4 | 58.25 | | Daily Target 5 | 58.47 |
Daily price and volume Victoryshares Us
| Date |
Closing |
Open |
Range |
Volume |
Mon 20 October 2025 |
58.04 (1.17%) |
57.54 |
57.54 - 58.11 |
1.924 times |
Fri 17 October 2025 |
57.37 (0.77%) |
56.68 |
56.68 - 57.40 |
2.0282 times |
Thu 16 October 2025 |
56.93 (-1.51%) |
57.76 |
56.73 - 57.76 |
0.4779 times |
Wed 15 October 2025 |
57.80 (-0.21%) |
58.02 |
57.65 - 58.47 |
0.5944 times |
Tue 14 October 2025 |
57.92 (1.38%) |
57.26 |
57.26 - 58.08 |
0.6066 times |
Mon 13 October 2025 |
57.13 (1.2%) |
57.12 |
56.85 - 57.20 |
0.815 times |
Fri 10 October 2025 |
56.45 (-2.72%) |
58.02 |
56.45 - 58.19 |
1.201 times |
Thu 09 October 2025 |
58.03 (-1.44%) |
58.49 |
57.89 - 58.55 |
0.8946 times |
Wed 08 October 2025 |
58.88 (0.22%) |
58.87 |
58.55 - 58.88 |
0.625 times |
Tue 07 October 2025 |
58.75 (-0.68%) |
59.16 |
58.64 - 59.16 |
0.8333 times |
Mon 06 October 2025 |
59.15 (-0.08%) |
59.29 |
59.04 - 59.50 |
0.4841 times |
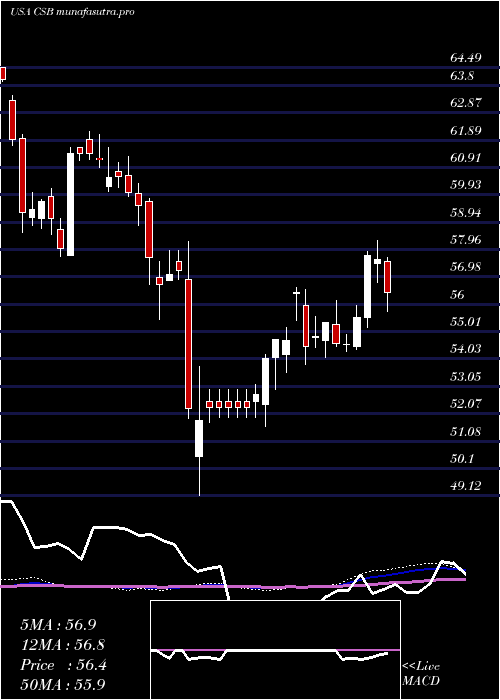
Weekly price and charts VictorysharesUs Strong weekly Stock price targets for VictorysharesUs CSB are 57.79 and 58.36 | Weekly Target 1 | 57.33 | | Weekly Target 2 | 57.68 | | Weekly Target 3 | 57.896666666667 | | Weekly Target 4 | 58.25 | | Weekly Target 5 | 58.47 |
Weekly price and volumes for Victoryshares Us
| Date |
Closing |
Open |
Range |
Volume |
Mon 20 October 2025 |
58.04 (1.17%) |
57.54 |
57.54 - 58.11 |
0.5151 times |
Fri 17 October 2025 |
57.37 (1.63%) |
57.12 |
56.68 - 58.47 |
1.2106 times |
Fri 10 October 2025 |
56.45 (-4.65%) |
59.29 |
56.45 - 59.50 |
1.081 times |
Fri 03 October 2025 |
59.20 (-0.49%) |
59.56 |
58.63 - 59.56 |
1.0206 times |
Fri 26 September 2025 |
59.49 (0.27%) |
59.25 |
58.79 - 59.90 |
1.2926 times |
Fri 19 September 2025 |
59.33 (-0.59%) |
59.74 |
59.00 - 60.53 |
1.2254 times |
Fri 12 September 2025 |
59.68 (-0.8%) |
59.95 |
59.02 - 60.22 |
1.3845 times |
Fri 05 September 2025 |
60.16 (0.7%) |
59.19 |
59.02 - 60.76 |
1.1105 times |
Fri 29 August 2025 |
59.74 (0%) |
59.63 |
59.62 - 59.83 |
0.0886 times |
Fri 29 August 2025 |
59.74 (-0.27%) |
59.74 |
59.07 - 60.05 |
1.0712 times |
Fri 22 August 2025 |
59.90 (3.35%) |
58.07 |
57.55 - 60.03 |
1.6601 times |
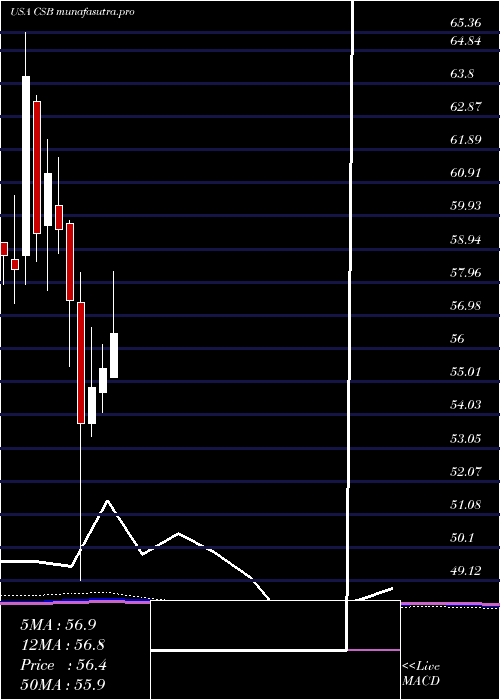
Monthly price and charts VictorysharesUs Strong monthly Stock price targets for VictorysharesUs CSB are 55.7 and 58.8 | Monthly Target 1 | 54.91 | | Monthly Target 2 | 56.48 | | Monthly Target 3 | 58.013333333333 | | Monthly Target 4 | 59.58 | | Monthly Target 5 | 61.11 |
Monthly price and volumes Victoryshares Us
| Date |
Closing |
Open |
Range |
Volume |
Mon 20 October 2025 |
58.04 (-1.88%) |
58.75 |
56.45 - 59.55 |
0.6847 times |
Tue 30 September 2025 |
59.15 (-0.99%) |
59.19 |
58.67 - 60.76 |
1.103 times |
Fri 29 August 2025 |
59.74 (6.39%) |
55.70 |
54.93 - 60.05 |
1.1003 times |
Thu 31 July 2025 |
56.15 (1.34%) |
55.15 |
55.15 - 58.28 |
1.3486 times |
Mon 30 June 2025 |
55.41 (1.06%) |
54.70 |
54.09 - 56.13 |
1.1849 times |
Fri 30 May 2025 |
54.83 (1.95%) |
53.79 |
53.39 - 56.61 |
0.8429 times |
Wed 30 April 2025 |
53.78 (-6.32%) |
57.35 |
49.12 - 58.24 |
1.3653 times |
Mon 31 March 2025 |
57.41 (-3.56%) |
59.70 |
55.46 - 59.80 |
0.8536 times |
Fri 28 February 2025 |
59.53 (-2.7%) |
60.23 |
58.82 - 61.64 |
0.691 times |
Fri 31 January 2025 |
61.18 (3%) |
59.63 |
57.72 - 62.19 |
0.8256 times |
Tue 31 December 2024 |
59.40 (-7.26%) |
63.30 |
58.57 - 63.50 |
0.5822 times |
DMA SMA EMA moving averages of Victoryshares Us CSB
DMA (daily moving average) of Victoryshares Us CSB
| DMA period | DMA value | | 5 day DMA | 57.61 | | 12 day DMA | 57.97 | | 20 day DMA | 58.45 | | 35 day DMA | 58.94 | | 50 day DMA | 58.91 | | 100 day DMA | 57.52 | | 150 day DMA | 56.5 | | 200 day DMA | 57.31 | EMA (exponential moving average) of Victoryshares Us CSB
| EMA period | EMA current | EMA prev | EMA prev2 | | 5 day EMA | 57.65 | 57.45 | 57.49 | | 12 day EMA | 57.93 | 57.91 | 58.01 | | 20 day EMA | 58.22 | 58.24 | 58.33 | | 35 day EMA | 58.4 | 58.42 | 58.48 | | 50 day EMA | 58.56 | 58.58 | 58.63 |
SMA (simple moving average) of Victoryshares Us CSB
| SMA period | SMA current | SMA prev | SMA prev2 | | 5 day SMA | 57.61 | 57.43 | 57.25 | | 12 day SMA | 57.97 | 58.04 | 58.18 | | 20 day SMA | 58.45 | 58.52 | 58.61 | | 35 day SMA | 58.94 | 58.99 | 59.06 | | 50 day SMA | 58.91 | 58.87 | 58.85 | | 100 day SMA | 57.52 | 57.5 | 57.47 | | 150 day SMA | 56.5 | 56.5 | 56.5 | | 200 day SMA | 57.31 | 57.32 | 57.33 |
|
|
