ChesapeakeUtilities CPK full analysis,charts,indicators,moving averages,SMA,DMA,EMA,ADX,MACD,RSIChesapeake Utilities CPK WideScreen charts, DMA,SMA,EMA technical analysis, forecast prediction, by indicators ADX,MACD,RSI,CCI USA stock exchange
operates under Public Utilities sector & deals in Oil Gas Production
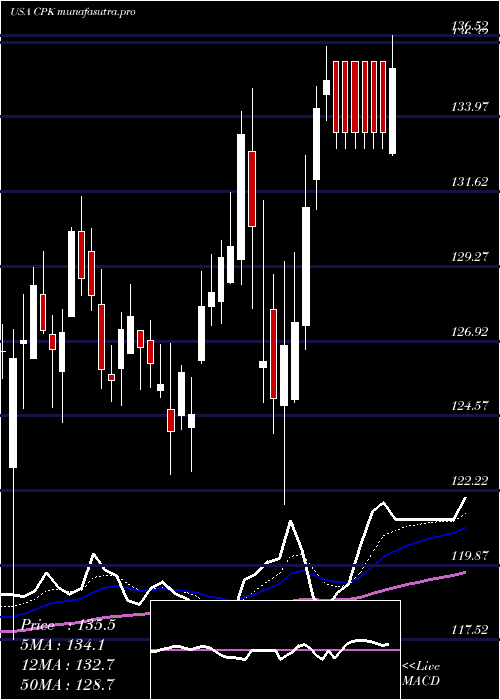
Daily price and charts and targets ChesapeakeUtilities Strong Daily Stock price targets for ChesapeakeUtilities CPK are 126.82 and 130.59 | Daily Target 1 | 126.12 | | Daily Target 2 | 127.52 | | Daily Target 3 | 129.89333333333 | | Daily Target 4 | 131.29 | | Daily Target 5 | 133.66 |
Daily price and volume Chesapeake Utilities
| Date |
Closing |
Open |
Range |
Volume |
Thu 04 December 2025 |
128.91 (-1.68%) |
130.32 |
128.50 - 132.27 |
0.7014 times |
Wed 03 December 2025 |
131.11 (-1.71%) |
134.30 |
130.70 - 134.92 |
0.8363 times |
Tue 02 December 2025 |
133.39 (-2.51%) |
137.32 |
133.25 - 137.32 |
0.6763 times |
Mon 01 December 2025 |
136.83 (-1.6%) |
138.29 |
135.97 - 138.29 |
0.6694 times |
Fri 28 November 2025 |
139.06 (0.49%) |
138.27 |
137.88 - 139.35 |
0.3777 times |
Wed 26 November 2025 |
138.38 (0.87%) |
136.59 |
136.59 - 139.57 |
1.5125 times |
Tue 25 November 2025 |
137.19 (-0.24%) |
137.62 |
135.65 - 139.55 |
1.3557 times |
Mon 24 November 2025 |
137.52 (0.28%) |
136.17 |
134.85 - 138.27 |
1.2792 times |
Fri 21 November 2025 |
137.14 (0.18%) |
137.34 |
136.17 - 138.62 |
1.3908 times |
Thu 20 November 2025 |
136.89 (1%) |
135.88 |
135.63 - 138.42 |
1.2008 times |
Wed 19 November 2025 |
135.54 (-0.32%) |
135.12 |
134.61 - 137.62 |
0.7566 times |
Weekly price and charts ChesapeakeUtilities Strong weekly Stock price targets for ChesapeakeUtilities CPK are 123.81 and 133.6 | Weekly Target 1 | 122.11 | | Weekly Target 2 | 125.51 | | Weekly Target 3 | 131.9 | | Weekly Target 4 | 135.3 | | Weekly Target 5 | 141.69 |
Weekly price and volumes for Chesapeake Utilities
| Date |
Closing |
Open |
Range |
Volume |
Thu 04 December 2025 |
128.91 (-7.3%) |
138.29 |
128.50 - 138.29 |
0.8088 times |
Fri 28 November 2025 |
139.06 (1.4%) |
136.17 |
134.85 - 139.57 |
1.2694 times |
Fri 21 November 2025 |
137.14 (1.9%) |
134.81 |
133.73 - 138.62 |
1.46 times |
Fri 14 November 2025 |
134.58 (-0.9%) |
134.54 |
131.43 - 135.90 |
1.2592 times |
Fri 07 November 2025 |
135.80 (6.69%) |
129.99 |
129.06 - 137.00 |
0.8189 times |
Fri 31 October 2025 |
127.28 (0%) |
127.35 |
126.17 - 128.37 |
0.2432 times |
Fri 31 October 2025 |
127.28 (-3.48%) |
131.70 |
126.17 - 132.41 |
1.0163 times |
Fri 24 October 2025 |
131.87 (-1.16%) |
133.92 |
128.99 - 135.03 |
1.1492 times |
Fri 17 October 2025 |
133.42 (-3.4%) |
137.77 |
131.52 - 137.77 |
1.5036 times |
Tue 07 October 2025 |
138.12 (1.21%) |
136.42 |
135.98 - 139.51 |
0.4713 times |
Fri 03 October 2025 |
136.47 (1.78%) |
133.42 |
132.48 - 137.28 |
1.1201 times |
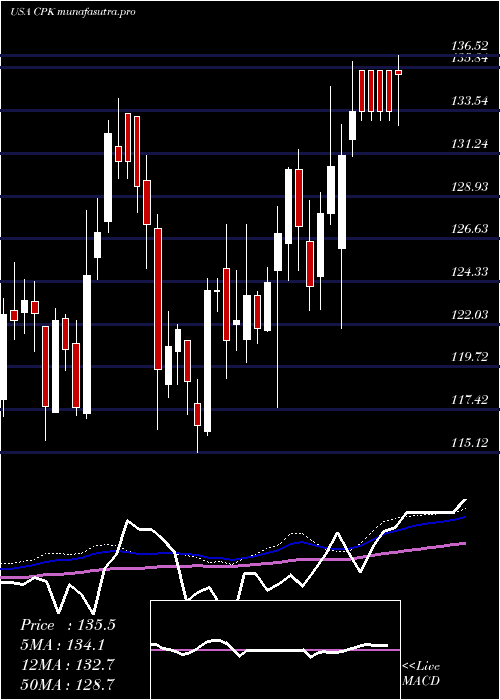
Monthly price and charts ChesapeakeUtilities Strong monthly Stock price targets for ChesapeakeUtilities CPK are 123.81 and 133.6 | Monthly Target 1 | 122.11 | | Monthly Target 2 | 125.51 | | Monthly Target 3 | 131.9 | | Monthly Target 4 | 135.3 | | Monthly Target 5 | 141.69 |
Monthly price and volumes Chesapeake Utilities
| Date |
Closing |
Open |
Range |
Volume |
Thu 04 December 2025 |
128.91 (-7.3%) |
138.29 |
128.50 - 138.29 |
0.191 times |
Fri 28 November 2025 |
139.06 (9.26%) |
129.99 |
129.06 - 139.57 |
1.1351 times |
Fri 31 October 2025 |
127.28 (-5.5%) |
134.49 |
126.17 - 139.51 |
1.1698 times |
Tue 30 September 2025 |
134.69 (8.99%) |
123.00 |
121.86 - 136.23 |
1.2929 times |
Fri 29 August 2025 |
123.58 (3.09%) |
120.54 |
118.84 - 127.72 |
0.883 times |
Thu 31 July 2025 |
119.88 (-0.28%) |
119.52 |
118.91 - 124.75 |
1.0219 times |
Mon 30 June 2025 |
120.22 (-1.61%) |
122.00 |
117.64 - 124.59 |
1.1866 times |
Fri 30 May 2025 |
122.19 (-7.2%) |
132.26 |
115.24 - 136.28 |
0.9704 times |
Wed 30 April 2025 |
131.67 (2.52%) |
128.16 |
121.77 - 136.73 |
1.3449 times |
Mon 31 March 2025 |
128.43 (1.18%) |
126.36 |
122.73 - 131.46 |
0.8044 times |
Fri 28 February 2025 |
126.93 (3.83%) |
121.19 |
117.52 - 128.38 |
0.6679 times |

DMA SMA EMA moving averages of Chesapeake Utilities CPK
DMA (daily moving average) of Chesapeake Utilities CPK
| DMA period | DMA value | | 5 day DMA | 133.86 | | 12 day DMA | 135.66 | | 20 day DMA | 135.16 | | 35 day DMA | 133.33 | | 50 day DMA | 133.56 | | 100 day DMA | 128.43 | | 150 day DMA | 126.77 | | 200 day DMA | 127.29 | EMA (exponential moving average) of Chesapeake Utilities CPK
| EMA period | EMA current | EMA prev | EMA prev2 | | 5 day EMA | 132.62 | 134.48 | 136.16 | | 12 day EMA | 134.31 | 135.29 | 136.05 | | 20 day EMA | 134.3 | 134.87 | 135.27 | | 35 day EMA | 133.92 | 134.21 | 134.39 | | 50 day EMA | 132.87 | 133.03 | 133.11 |
SMA (simple moving average) of Chesapeake Utilities CPK
| SMA period | SMA current | SMA prev | SMA prev2 | | 5 day SMA | 133.86 | 135.75 | 136.97 | | 12 day SMA | 135.66 | 136.13 | 136.42 | | 20 day SMA | 135.16 | 135.23 | 135.25 | | 35 day SMA | 133.33 | 133.43 | 133.53 | | 50 day SMA | 133.56 | 133.55 | 133.46 | | 100 day SMA | 128.43 | 128.38 | 128.3 | | 150 day SMA | 126.77 | 126.79 | 126.8 | | 200 day SMA | 127.29 | 127.25 | 127.21 |
|
|
