CpbInc CPF full analysis,charts,indicators,moving averages,SMA,DMA,EMA,ADX,MACD,RSICpb Inc CPF WideScreen charts, DMA,SMA,EMA technical analysis, forecast prediction, by indicators ADX,MACD,RSI,CCI USA stock exchange
operates under Finance sector & deals in Major Banks
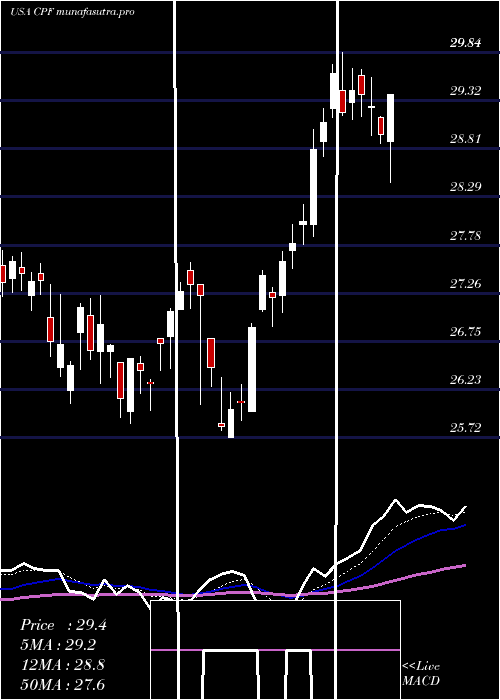
Daily price and charts and targets CpbInc Strong Daily Stock price targets for CpbInc CPF are 30.47 and 31 | Daily Target 1 | 30.07 | | Daily Target 2 | 30.34 | | Daily Target 3 | 30.6 | | Daily Target 4 | 30.87 | | Daily Target 5 | 31.13 |
Daily price and volume Cpb Inc
| Date |
Closing |
Open |
Range |
Volume |
Thu 04 December 2025 |
30.61 (0.46%) |
30.33 |
30.33 - 30.86 |
0.6967 times |
Wed 03 December 2025 |
30.47 (1.23%) |
30.22 |
29.89 - 31.04 |
1.0796 times |
Tue 02 December 2025 |
30.10 (-1.25%) |
30.44 |
30.02 - 30.49 |
0.775 times |
Mon 01 December 2025 |
30.48 (2.49%) |
29.71 |
29.38 - 30.50 |
1.1166 times |
Fri 28 November 2025 |
29.74 (-1.78%) |
30.06 |
29.74 - 30.46 |
0.701 times |
Wed 26 November 2025 |
30.28 (-0.62%) |
30.40 |
30.28 - 30.80 |
1.7024 times |
Tue 25 November 2025 |
30.47 (2.8%) |
29.94 |
29.94 - 30.88 |
1.1045 times |
Mon 24 November 2025 |
29.64 (-0.24%) |
29.77 |
29.52 - 30.05 |
0.9608 times |
Fri 21 November 2025 |
29.71 (3.12%) |
28.96 |
28.96 - 29.97 |
0.8149 times |
Thu 20 November 2025 |
28.81 (0%) |
28.89 |
28.69 - 29.43 |
1.0483 times |
Wed 19 November 2025 |
28.81 (0.98%) |
28.58 |
28.48 - 29.04 |
0.5558 times |
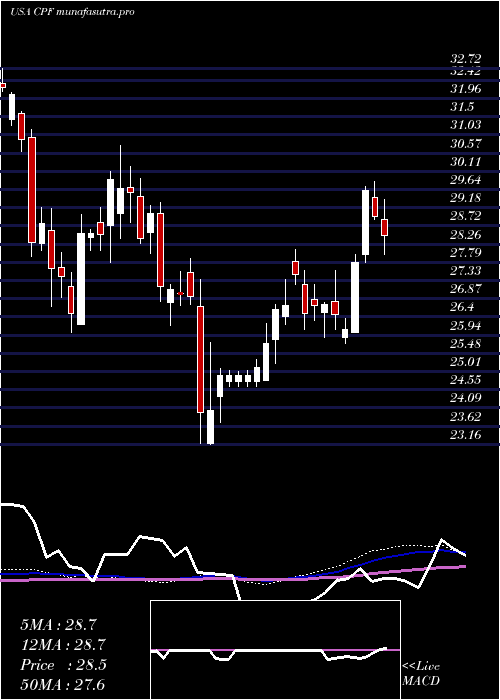
Weekly price and charts CpbInc Strong weekly Stock price targets for CpbInc CPF are 30 and 31.66 | Weekly Target 1 | 28.68 | | Weekly Target 2 | 29.65 | | Weekly Target 3 | 30.343333333333 | | Weekly Target 4 | 31.31 | | Weekly Target 5 | 32 |
Weekly price and volumes for Cpb Inc
| Date |
Closing |
Open |
Range |
Volume |
Thu 04 December 2025 |
30.61 (2.93%) |
29.71 |
29.38 - 31.04 |
0.8847 times |
Fri 28 November 2025 |
29.74 (0.1%) |
29.77 |
29.52 - 30.88 |
1.0778 times |
Fri 21 November 2025 |
29.71 (0.64%) |
29.58 |
28.44 - 29.97 |
0.9278 times |
Fri 14 November 2025 |
29.52 (0.51%) |
29.41 |
29.05 - 30.07 |
0.98 times |
Fri 07 November 2025 |
29.37 (3.02%) |
28.96 |
28.54 - 29.37 |
1.1941 times |
Fri 31 October 2025 |
28.51 (0%) |
28.79 |
28.17 - 28.82 |
0.2669 times |
Fri 31 October 2025 |
28.51 (-3.09%) |
29.56 |
28.10 - 31.19 |
1.4385 times |
Fri 24 October 2025 |
29.42 (4.51%) |
28.30 |
28.10 - 29.51 |
0.9089 times |
Fri 17 October 2025 |
28.15 (-1.4%) |
28.89 |
27.38 - 29.90 |
1.1417 times |
Fri 10 October 2025 |
28.55 (-5.74%) |
30.40 |
28.49 - 31.05 |
1.1795 times |
Fri 03 October 2025 |
30.29 (-1.43%) |
30.69 |
29.58 - 30.80 |
0.9984 times |
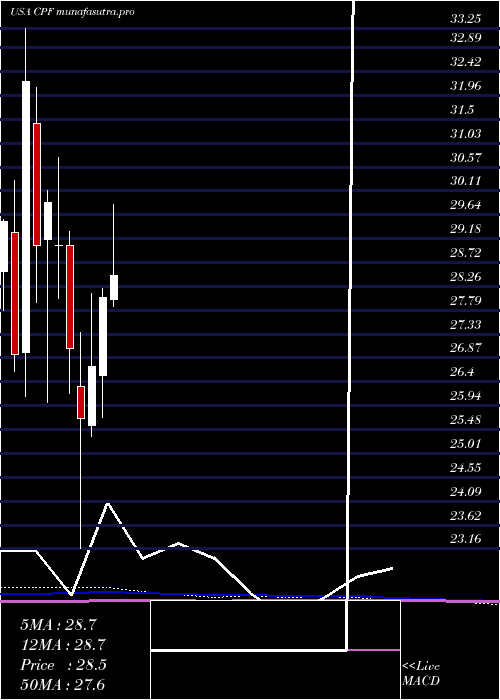
Monthly price and charts CpbInc Strong monthly Stock price targets for CpbInc CPF are 30 and 31.66 | Monthly Target 1 | 28.68 | | Monthly Target 2 | 29.65 | | Monthly Target 3 | 30.343333333333 | | Monthly Target 4 | 31.31 | | Monthly Target 5 | 32 |
Monthly price and volumes Cpb Inc
| Date |
Closing |
Open |
Range |
Volume |
Thu 04 December 2025 |
30.61 (2.93%) |
29.71 |
29.38 - 31.04 |
0.1765 times |
Fri 28 November 2025 |
29.74 (4.31%) |
28.96 |
28.44 - 30.88 |
0.8336 times |
Fri 31 October 2025 |
28.51 (-6.03%) |
30.13 |
27.38 - 31.19 |
1.1071 times |
Tue 30 September 2025 |
30.34 (-3.13%) |
30.92 |
29.75 - 31.91 |
1.1229 times |
Fri 29 August 2025 |
31.32 (17.48%) |
26.25 |
25.62 - 31.86 |
1.149 times |
Thu 31 July 2025 |
26.66 (-4.89%) |
28.00 |
26.40 - 29.84 |
0.9896 times |
Mon 30 June 2025 |
28.03 (4.98%) |
26.52 |
25.72 - 28.21 |
1.3563 times |
Fri 30 May 2025 |
26.70 (3.93%) |
25.56 |
25.34 - 28.11 |
1.0163 times |
Wed 30 April 2025 |
25.69 (-4.99%) |
26.32 |
23.16 - 27.35 |
1.1409 times |
Mon 31 March 2025 |
27.04 (-6.89%) |
29.04 |
26.18 - 29.31 |
1.1078 times |
Fri 28 February 2025 |
29.04 (-2.84%) |
29.04 |
28.01 - 30.76 |
1.0965 times |
DMA SMA EMA moving averages of Cpb Inc CPF
DMA (daily moving average) of Cpb Inc CPF
| DMA period | DMA value | | 5 day DMA | 30.28 | | 12 day DMA | 29.8 | | 20 day DMA | 29.62 | | 35 day DMA | 29.3 | | 50 day DMA | 29.48 | | 100 day DMA | 29.4 | | 150 day DMA | 28.72 | | 200 day DMA | 28.15 | EMA (exponential moving average) of Cpb Inc CPF
| EMA period | EMA current | EMA prev | EMA prev2 | | 5 day EMA | 30.34 | 30.2 | 30.07 | | 12 day EMA | 29.99 | 29.88 | 29.77 | | 20 day EMA | 29.79 | 29.7 | 29.62 | | 35 day EMA | 29.71 | 29.66 | 29.61 | | 50 day EMA | 29.68 | 29.64 | 29.61 |
SMA (simple moving average) of Cpb Inc CPF
| SMA period | SMA current | SMA prev | SMA prev2 | | 5 day SMA | 30.28 | 30.21 | 30.21 | | 12 day SMA | 29.8 | 29.63 | 29.55 | | 20 day SMA | 29.62 | 29.55 | 29.47 | | 35 day SMA | 29.3 | 29.26 | 29.23 | | 50 day SMA | 29.48 | 29.48 | 29.48 | | 100 day SMA | 29.4 | 29.37 | 29.36 | | 150 day SMA | 28.72 | 28.68 | 28.65 | | 200 day SMA | 28.15 | 28.14 | 28.14 |
|
|
