CostcoWholesale COST full analysis,charts,indicators,moving averages,SMA,DMA,EMA,ADX,MACD,RSICostco Wholesale COST WideScreen charts, DMA,SMA,EMA technical analysis, forecast prediction, by indicators ADX,MACD,RSI,CCI USA stock exchange
operates under Consumer Services sector & deals in Department Specialty Retail Stores
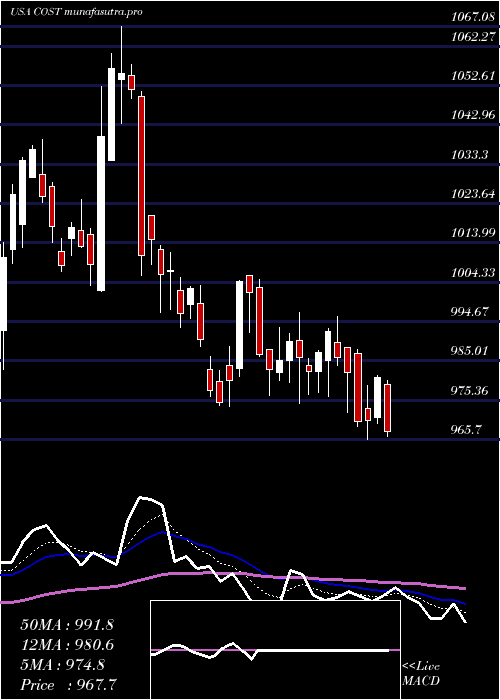
Daily price and charts and targets CostcoWholesale Strong Daily Stock price targets for CostcoWholesale COST are 933.06 and 942.86 | Daily Target 1 | 925.5 | | Daily Target 2 | 930.81 | | Daily Target 3 | 935.30333333333 | | Daily Target 4 | 940.61 | | Daily Target 5 | 945.1 |
Daily price and volume Costco Wholesale
| Date |
Closing |
Open |
Range |
Volume |
Mon 20 October 2025 |
936.11 (0.01%) |
933.40 |
930.00 - 939.80 |
0.2133 times |
Fri 17 October 2025 |
936.00 (1.18%) |
922.80 |
922.80 - 938.82 |
0.6166 times |
Thu 16 October 2025 |
925.04 (-3.14%) |
951.00 |
921.16 - 957.90 |
0.6811 times |
Wed 15 October 2025 |
954.99 (0.9%) |
946.00 |
945.26 - 964.00 |
0.9495 times |
Tue 14 October 2025 |
946.51 (1.17%) |
940.26 |
935.95 - 947.42 |
0.9098 times |
Mon 13 October 2025 |
935.56 (0.6%) |
929.00 |
923.00 - 935.98 |
1.025 times |
Fri 10 October 2025 |
930.01 (-1.37%) |
944.42 |
929.00 - 945.45 |
1.4846 times |
Thu 09 October 2025 |
942.89 (3.07%) |
932.31 |
927.28 - 943.77 |
1.7682 times |
Wed 08 October 2025 |
914.80 (0%) |
912.53 |
910.96 - 916.38 |
1.1229 times |
Tue 07 October 2025 |
914.80 (0.78%) |
908.73 |
903.88 - 917.64 |
1.2291 times |
Mon 06 October 2025 |
907.71 (-0.68%) |
917.20 |
904.25 - 917.20 |
0.5804 times |
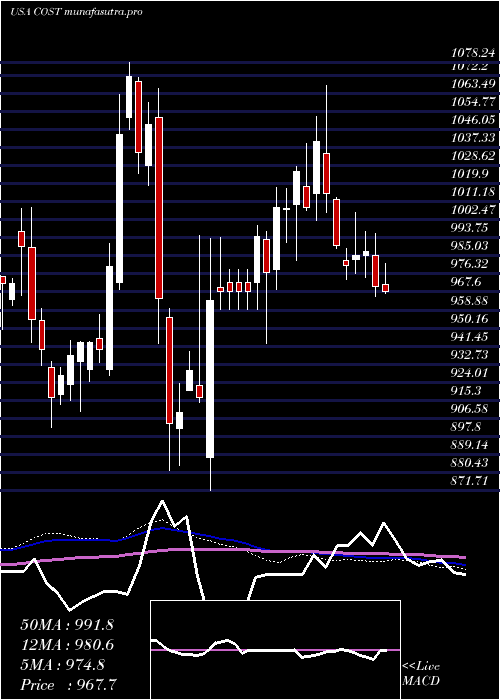
Weekly price and charts CostcoWholesale Strong weekly Stock price targets for CostcoWholesale COST are 933.06 and 942.86 | Weekly Target 1 | 925.5 | | Weekly Target 2 | 930.81 | | Weekly Target 3 | 935.30333333333 | | Weekly Target 4 | 940.61 | | Weekly Target 5 | 945.1 |
Weekly price and volumes for Costco Wholesale
| Date |
Closing |
Open |
Range |
Volume |
Mon 20 October 2025 |
936.11 (0.01%) |
933.40 |
930.00 - 939.80 |
0.0491 times |
Fri 17 October 2025 |
936.00 (0.64%) |
929.00 |
921.16 - 964.00 |
0.9635 times |
Fri 10 October 2025 |
930.01 (1.76%) |
917.20 |
903.88 - 945.45 |
1.4251 times |
Fri 03 October 2025 |
913.90 (-0.22%) |
916.34 |
903.29 - 930.51 |
1.315 times |
Fri 26 September 2025 |
915.95 (-3.7%) |
947.38 |
905.05 - 953.66 |
1.7408 times |
Fri 19 September 2025 |
951.16 (-1.73%) |
967.82 |
943.79 - 969.74 |
1.3315 times |
Fri 12 September 2025 |
967.90 (0.46%) |
963.73 |
953.96 - 981.00 |
0.9256 times |
Fri 05 September 2025 |
963.48 (2.14%) |
938.66 |
936.50 - 969.55 |
0.747 times |
Fri 29 August 2025 |
943.32 (0%) |
945.00 |
940.46 - 948.61 |
0.1751 times |
Fri 29 August 2025 |
943.32 (-1.59%) |
954.96 |
933.24 - 958.30 |
1.3273 times |
Fri 22 August 2025 |
958.54 (-1.39%) |
973.30 |
953.11 - 999.30 |
1.2258 times |
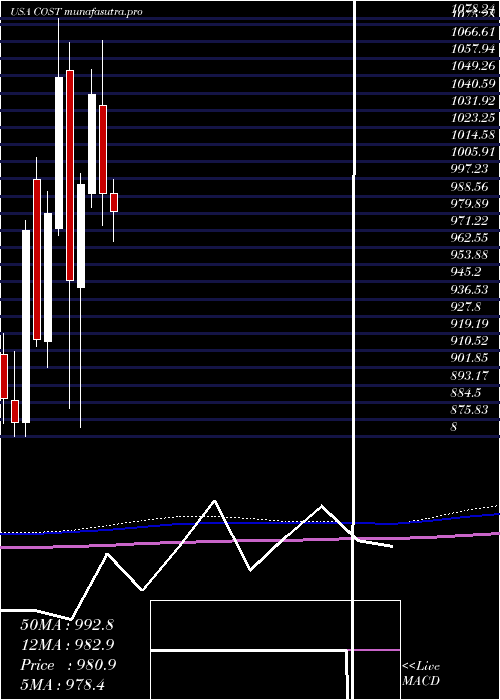
Monthly price and charts CostcoWholesale Strong monthly Stock price targets for CostcoWholesale COST are 920 and 980.12 | Monthly Target 1 | 874.54 | | Monthly Target 2 | 905.33 | | Monthly Target 3 | 934.66333333333 | | Monthly Target 4 | 965.45 | | Monthly Target 5 | 994.78 |
Monthly price and volumes Costco Wholesale
| Date |
Closing |
Open |
Range |
Volume |
Mon 20 October 2025 |
936.11 (1.13%) |
923.00 |
903.88 - 964.00 |
0.6221 times |
Tue 30 September 2025 |
925.63 (-1.88%) |
938.66 |
903.29 - 981.00 |
1.1585 times |
Fri 29 August 2025 |
943.32 (0.39%) |
939.50 |
933.24 - 999.30 |
1.0713 times |
Thu 31 July 2025 |
939.64 (-5.08%) |
990.00 |
925.00 - 996.84 |
1.0321 times |
Mon 30 June 2025 |
989.94 (-4.83%) |
1034.27 |
973.90 - 1067.08 |
0.9096 times |
Fri 30 May 2025 |
1040.18 (4.59%) |
990.10 |
983.00 - 1052.49 |
0.9677 times |
Wed 30 April 2025 |
994.50 (5.15%) |
942.42 |
871.71 - 999.92 |
1.2799 times |
Mon 31 March 2025 |
945.78 (-9.81%) |
1051.74 |
881.56 - 1066.00 |
1.1518 times |
Fri 28 February 2025 |
1048.61 (7.01%) |
972.39 |
968.94 - 1078.24 |
0.8377 times |
Fri 31 January 2025 |
979.88 (6.94%) |
915.00 |
902.00 - 991.00 |
0.9695 times |
Tue 31 December 2024 |
916.27 (-5.69%) |
997.01 |
912.54 - 1008.25 |
0.7656 times |
DMA SMA EMA moving averages of Costco Wholesale COST
DMA (daily moving average) of Costco Wholesale COST
| DMA period | DMA value | | 5 day DMA | 939.73 | | 12 day DMA | 929.86 | | 20 day DMA | 929.11 | | 35 day DMA | 941.48 | | 50 day DMA | 948.33 | | 100 day DMA | 964.63 | | 150 day DMA | 967.9 | | 200 day DMA | 972.6 | EMA (exponential moving average) of Costco Wholesale COST
| EMA period | EMA current | EMA prev | EMA prev2 | | 5 day EMA | 936.1 | 936.1 | 936.15 | | 12 day EMA | 933.96 | 933.57 | 933.13 | | 20 day EMA | 935.13 | 935.03 | 934.93 | | 35 day EMA | 940.58 | 940.84 | 941.13 | | 50 day EMA | 949.33 | 949.87 | 950.44 |
SMA (simple moving average) of Costco Wholesale COST
| SMA period | SMA current | SMA prev | SMA prev2 | | 5 day SMA | 939.73 | 939.62 | 938.42 | | 12 day SMA | 929.86 | 928.18 | 926.63 | | 20 day SMA | 929.11 | 929.47 | 930.23 | | 35 day SMA | 941.48 | 941.69 | 941.9 | | 50 day SMA | 948.33 | 949.38 | 950.28 | | 100 day SMA | 964.63 | 965.45 | 966.18 | | 150 day SMA | 967.9 | 967.68 | 967.38 | | 200 day SMA | 972.6 | 972.47 | 972.37 |
|
|
