CoresiteRealty COR full analysis,charts,indicators,moving averages,SMA,DMA,EMA,ADX,MACD,RSICoresite Realty COR WideScreen charts, DMA,SMA,EMA technical analysis, forecast prediction, by indicators ADX,MACD,RSI,CCI USA stock exchange
operates under Consumer Services sector & deals in Real Estate Investment Trusts
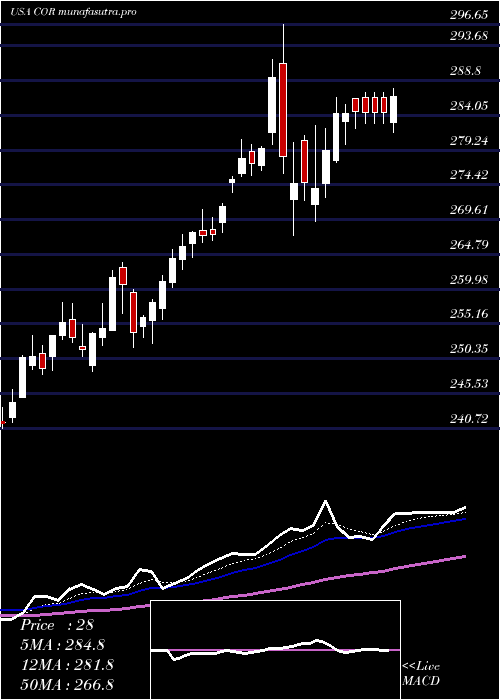
Daily price and charts and targets CoresiteRealty Strong Daily Stock price targets for CoresiteRealty COR are 325.38 and 331.6 | Daily Target 1 | 320.56 | | Daily Target 2 | 323.97 | | Daily Target 3 | 326.77666666667 | | Daily Target 4 | 330.19 | | Daily Target 5 | 333 |
Daily price and volume Coresite Realty
| Date |
Closing |
Open |
Range |
Volume |
Mon 20 October 2025 |
327.39 (0.83%) |
325.30 |
323.36 - 329.58 |
0.991 times |
Fri 17 October 2025 |
324.69 (1.66%) |
319.75 |
319.37 - 325.70 |
1.1103 times |
Thu 16 October 2025 |
319.40 (-0.07%) |
319.65 |
318.10 - 321.87 |
1.3193 times |
Wed 15 October 2025 |
319.61 (0.53%) |
316.25 |
316.25 - 320.37 |
0.7541 times |
Tue 14 October 2025 |
317.93 (0.29%) |
318.95 |
314.50 - 319.39 |
0.6859 times |
Mon 13 October 2025 |
317.00 (-0.31%) |
313.58 |
313.58 - 319.87 |
1.4265 times |
Fri 10 October 2025 |
318.00 (1.24%) |
316.58 |
314.71 - 319.68 |
1.3724 times |
Thu 09 October 2025 |
314.12 (1.13%) |
310.54 |
307.87 - 314.26 |
0.8765 times |
Wed 08 October 2025 |
310.61 (0.62%) |
308.82 |
305.65 - 310.84 |
0.6382 times |
Tue 07 October 2025 |
308.71 (1.12%) |
304.13 |
301.36 - 308.78 |
0.8259 times |
Mon 06 October 2025 |
305.30 (0.84%) |
299.71 |
299.26 - 305.67 |
0.6997 times |
Weekly price and charts CoresiteRealty Strong weekly Stock price targets for CoresiteRealty COR are 325.38 and 331.6 | Weekly Target 1 | 320.56 | | Weekly Target 2 | 323.97 | | Weekly Target 3 | 326.77666666667 | | Weekly Target 4 | 330.19 | | Weekly Target 5 | 333 |
Weekly price and volumes for Coresite Realty
| Date |
Closing |
Open |
Range |
Volume |
Mon 20 October 2025 |
327.39 (0.83%) |
325.30 |
323.36 - 329.58 |
0.1766 times |
Fri 17 October 2025 |
324.69 (2.1%) |
313.58 |
313.58 - 325.70 |
0.9437 times |
Fri 10 October 2025 |
318.00 (5.03%) |
299.71 |
299.26 - 319.68 |
0.7863 times |
Fri 03 October 2025 |
302.76 (-1.38%) |
306.05 |
296.08 - 315.23 |
0.982 times |
Fri 26 September 2025 |
307.00 (5.85%) |
290.02 |
285.83 - 310.00 |
1.2706 times |
Fri 19 September 2025 |
290.02 (-4.13%) |
301.40 |
285.76 - 303.30 |
2.4251 times |
Fri 12 September 2025 |
302.52 (3.43%) |
292.77 |
290.67 - 307.51 |
1.4301 times |
Fri 05 September 2025 |
292.50 (0.31%) |
291.97 |
290.05 - 298.09 |
0.8294 times |
Fri 29 August 2025 |
291.61 (0%) |
291.00 |
289.30 - 292.02 |
0.1887 times |
Fri 29 August 2025 |
291.61 (-0.34%) |
292.56 |
287.29 - 293.80 |
0.9673 times |
Fri 22 August 2025 |
292.60 (-0.08%) |
293.53 |
288.32 - 306.28 |
1.2021 times |

Monthly price and charts CoresiteRealty Strong monthly Stock price targets for CoresiteRealty COR are 311.74 and 345.24 | Monthly Target 1 | 284.18 | | Monthly Target 2 | 305.79 | | Monthly Target 3 | 317.68333333333 | | Monthly Target 4 | 339.29 | | Monthly Target 5 | 351.18 |
Monthly price and volumes Coresite Realty
| Date |
Closing |
Open |
Range |
Volume |
Mon 20 October 2025 |
327.39 (4.75%) |
313.28 |
296.08 - 329.58 |
0.4792 times |
Tue 30 September 2025 |
312.53 (7.17%) |
291.97 |
285.76 - 312.73 |
1.238 times |
Fri 29 August 2025 |
291.61 (1.93%) |
288.49 |
273.43 - 306.28 |
0.9612 times |
Thu 31 July 2025 |
286.08 (-4.59%) |
300.42 |
281.84 - 303.18 |
0.7404 times |
Mon 30 June 2025 |
299.85 (2.96%) |
290.29 |
281.57 - 301.87 |
0.853 times |
Fri 30 May 2025 |
291.24 (-0.49%) |
289.72 |
271.00 - 309.35 |
1.2423 times |
Wed 30 April 2025 |
292.67 (5.24%) |
279.02 |
267.40 - 296.65 |
1.3381 times |
Mon 31 March 2025 |
278.09 (9.68%) |
253.54 |
248.59 - 280.70 |
1.1294 times |
Fri 28 February 2025 |
253.54 (-0.26%) |
253.68 |
237.71 - 262.26 |
1.0686 times |
Fri 31 January 2025 |
254.21 (13.14%) |
225.88 |
223.92 - 261.25 |
0.9498 times |
Tue 31 December 2024 |
224.68 (-9.57%) |
251.74 |
223.92 - 252.94 |
0.6008 times |

DMA SMA EMA moving averages of Coresite Realty COR
DMA (daily moving average) of Coresite Realty COR
| DMA period | DMA value | | 5 day DMA | 321.8 | | 12 day DMA | 315.46 | | 20 day DMA | 312.15 | | 35 day DMA | 304.47 | | 50 day DMA | 301.01 | | 100 day DMA | 296.61 | | 150 day DMA | 291.78 | | 200 day DMA | 280.49 | EMA (exponential moving average) of Coresite Realty COR
| EMA period | EMA current | EMA prev | EMA prev2 | | 5 day EMA | 322.48 | 320.02 | 317.69 | | 12 day EMA | 317.12 | 315.25 | 313.54 | | 20 day EMA | 312.74 | 311.2 | 309.78 | | 35 day EMA | 307.35 | 306.17 | 305.08 | | 50 day EMA | 301.89 | 300.85 | 299.88 |
SMA (simple moving average) of Coresite Realty COR
| SMA period | SMA current | SMA prev | SMA prev2 | | 5 day SMA | 321.8 | 319.73 | 318.39 | | 12 day SMA | 315.46 | 313.89 | 312.82 | | 20 day SMA | 312.15 | 310.22 | 308.49 | | 35 day SMA | 304.47 | 303.45 | 302.5 | | 50 day SMA | 301.01 | 300.28 | 299.49 | | 100 day SMA | 296.61 | 296.27 | 295.95 | | 150 day SMA | 291.78 | 291.3 | 290.83 | | 200 day SMA | 280.49 | 279.98 | 279.48 |
|
|
