MrCooper COOP full analysis,charts,indicators,moving averages,SMA,DMA,EMA,ADX,MACD,RSIMr Cooper COOP WideScreen charts, DMA,SMA,EMA technical analysis, forecast prediction, by indicators ADX,MACD,RSI,CCI USA stock exchange
operates under Finance sector & deals in Finance Consumer Services
Daily price and charts and targets MrCooper Strong Daily Stock price targets for MrCooper COOP are 168.81 and 186.03 | Daily Target 1 | 155.51 | | Daily Target 2 | 164.88 | | Daily Target 3 | 172.72666666667 | | Daily Target 4 | 182.1 | | Daily Target 5 | 189.95 |
Daily price and volume Mr Cooper
| Date |
Closing |
Open |
Range |
Volume |
Fri 01 August 2025 |
174.26 (11.91%) |
163.72 |
163.35 - 180.57 |
1.4834 times |
Thu 31 July 2025 |
155.72 (0.48%) |
157.88 |
152.70 - 160.46 |
0.6152 times |
Wed 30 July 2025 |
154.97 (-2.97%) |
158.82 |
153.31 - 160.22 |
0.4643 times |
Tue 29 July 2025 |
159.71 (0.88%) |
159.05 |
158.23 - 163.84 |
0.4975 times |
Mon 28 July 2025 |
158.32 (0.76%) |
156.01 |
153.83 - 158.60 |
0.6115 times |
Fri 25 July 2025 |
157.13 (0.48%) |
156.93 |
154.12 - 158.86 |
0.3721 times |
Thu 24 July 2025 |
156.38 (-7.63%) |
167.67 |
156.22 - 167.86 |
0.6997 times |
Wed 23 July 2025 |
169.29 (0.1%) |
178.70 |
164.88 - 178.89 |
1.8777 times |
Tue 22 July 2025 |
169.12 (5.17%) |
163.54 |
163.14 - 173.94 |
1.854 times |
Mon 21 July 2025 |
160.81 (6.9%) |
153.20 |
152.98 - 163.85 |
1.5247 times |
Fri 18 July 2025 |
150.43 (1.5%) |
149.11 |
147.09 - 151.38 |
0.5538 times |
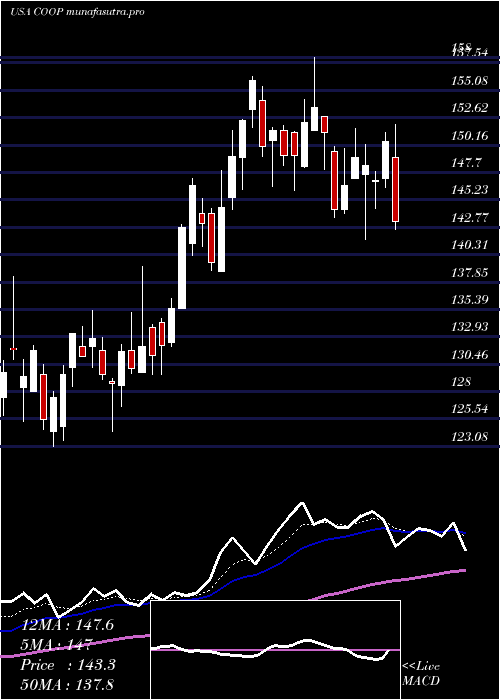
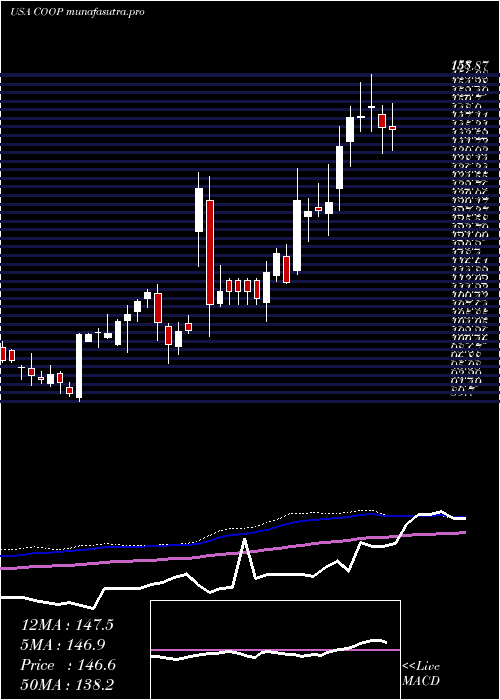
Weekly price and charts MrCooper Strong weekly Stock price targets for MrCooper COOP are 163.48 and 191.35 | Weekly Target 1 | 141.31 | | Weekly Target 2 | 157.78 | | Weekly Target 3 | 169.17666666667 | | Weekly Target 4 | 185.65 | | Weekly Target 5 | 197.05 |
Weekly price and volumes for Mr Cooper
| Date |
Closing |
Open |
Range |
Volume |
Fri 01 August 2025 |
174.26 (10.9%) |
156.01 |
152.70 - 180.57 |
0.8701 times |
Fri 25 July 2025 |
157.13 (4.45%) |
153.20 |
152.98 - 178.89 |
1.4996 times |
Fri 18 July 2025 |
150.43 (2.33%) |
147.17 |
142.22 - 151.97 |
0.6494 times |
Fri 11 July 2025 |
147.00 (-2.85%) |
149.62 |
141.63 - 151.63 |
0.9249 times |
Thu 03 July 2025 |
151.31 (1.4%) |
151.27 |
146.11 - 158.00 |
0.7896 times |
Fri 27 June 2025 |
149.22 (0.07%) |
149.06 |
146.19 - 156.35 |
2.4281 times |
Fri 20 June 2025 |
149.12 (4.22%) |
144.02 |
138.83 - 151.48 |
0.64 times |
Fri 13 June 2025 |
143.08 (8.99%) |
134.20 |
129.58 - 147.13 |
0.8225 times |
Fri 06 June 2025 |
131.28 (1.35%) |
128.89 |
124.45 - 139.23 |
0.8305 times |
Fri 30 May 2025 |
129.53 (0.02%) |
130.16 |
128.44 - 135.30 |
0.5453 times |
Fri 23 May 2025 |
129.50 (-1.75%) |
128.41 |
123.08 - 132.13 |
0.7406 times |
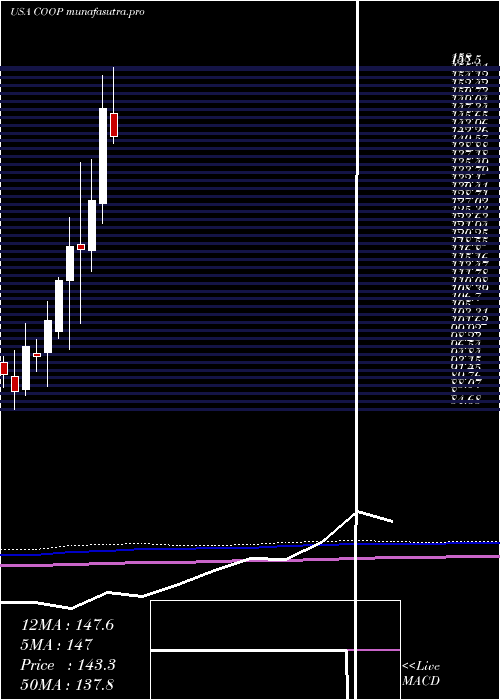
Monthly price and charts MrCooper Strong monthly Stock price targets for MrCooper COOP are 168.81 and 186.03 | Monthly Target 1 | 155.51 | | Monthly Target 2 | 164.88 | | Monthly Target 3 | 172.72666666667 | | Monthly Target 4 | 182.1 | | Monthly Target 5 | 189.95 |
Monthly price and volumes Mr Cooper
| Date |
Closing |
Open |
Range |
Volume |
Fri 01 August 2025 |
174.26 (11.91%) |
163.72 |
163.35 - 180.57 |
0.1293 times |
Thu 31 July 2025 |
155.72 (4.36%) |
148.22 |
141.63 - 178.89 |
1.5487 times |
Mon 30 June 2025 |
149.21 (15.19%) |
128.89 |
124.45 - 156.35 |
1.7985 times |
Fri 30 May 2025 |
129.53 (8.84%) |
118.73 |
114.26 - 138.35 |
1.1745 times |
Wed 30 April 2025 |
119.01 (-0.49%) |
119.99 |
103.15 - 137.60 |
1.7478 times |
Mon 31 March 2025 |
119.60 (6.43%) |
112.26 |
97.58 - 125.86 |
1.2017 times |
Fri 28 February 2025 |
112.37 (8.25%) |
101.49 |
100.00 - 112.99 |
0.6467 times |
Fri 31 January 2025 |
103.81 (8.12%) |
96.96 |
89.70 - 107.85 |
0.7088 times |
Tue 31 December 2024 |
96.01 (-2.32%) |
96.74 |
92.88 - 99.70 |
0.426 times |
Tue 26 November 2024 |
98.29 (11%) |
88.95 |
87.70 - 103.05 |
0.6179 times |
Thu 31 October 2024 |
88.55 (-3.94%) |
91.75 |
84.68 - 97.35 |
0.7144 times |
DMA SMA EMA moving averages of Mr Cooper COOP
DMA (daily moving average) of Mr Cooper COOP
| DMA period | DMA value | | 5 day DMA | 160.6 | | 12 day DMA | 159.53 | | 20 day DMA | 154.5 | | 35 day DMA | 152.03 | | 50 day DMA | 145.66 | | 100 day DMA | 130.42 | | 150 day DMA | 121.42 | | 200 day DMA | 114.83 | EMA (exponential moving average) of Mr Cooper COOP
| EMA period | EMA current | EMA prev | EMA prev2 | | 5 day EMA | 162.79 | 157.05 | 157.72 | | 12 day EMA | 159.1 | 156.35 | 156.47 | | 20 day EMA | 156.15 | 154.25 | 154.1 | | 35 day EMA | 150.71 | 149.32 | 148.94 | | 50 day EMA | 145.88 | 144.72 | 144.27 |
SMA (simple moving average) of Mr Cooper COOP
| SMA period | SMA current | SMA prev | SMA prev2 | | 5 day SMA | 160.6 | 157.17 | 157.3 | | 12 day SMA | 159.53 | 157.23 | 156.19 | | 20 day SMA | 154.5 | 153.36 | 153.25 | | 35 day SMA | 152.03 | 150.92 | 150.25 | | 50 day SMA | 145.66 | 144.77 | 144.29 | | 100 day SMA | 130.42 | 129.74 | 129.26 | | 150 day SMA | 121.42 | 120.89 | 120.47 | | 200 day SMA | 114.83 | 114.41 | 114.09 |
|
|
