CooperCompanies COO full analysis,charts,indicators,moving averages,SMA,DMA,EMA,ADX,MACD,RSICooper Companies COO WideScreen charts, DMA,SMA,EMA technical analysis, forecast prediction, by indicators ADX,MACD,RSI,CCI USA stock exchange
operates under Health Care sector & deals in Ophthalmic Goods
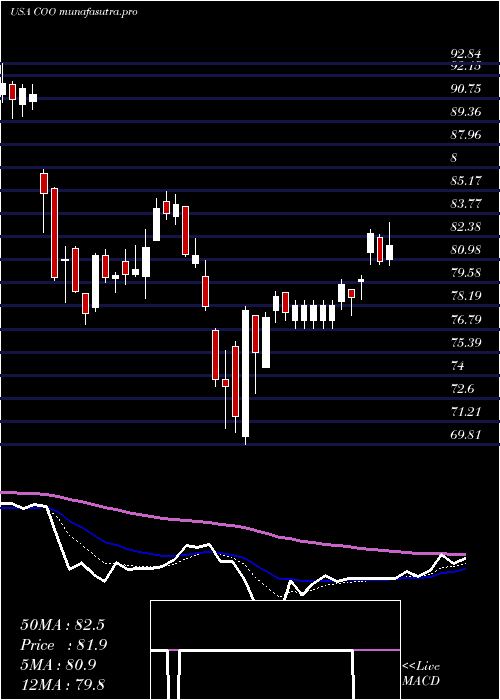
Daily price and charts and targets CooperCompanies Strong Daily Stock price targets for CooperCompanies COO are 74.71 and 75.93 | Daily Target 1 | 73.8 | | Daily Target 2 | 74.4 | | Daily Target 3 | 75.02 | | Daily Target 4 | 75.62 | | Daily Target 5 | 76.24 |
Daily price and volume Cooper Companies
| Date |
Closing |
Open |
Range |
Volume |
Tue 21 October 2025 |
75.00 (0.01%) |
74.67 |
74.42 - 75.64 |
0.8568 times |
Mon 20 October 2025 |
74.99 (4.2%) |
76.02 |
73.48 - 76.22 |
1.3498 times |
Fri 17 October 2025 |
71.97 (1.37%) |
71.20 |
70.71 - 72.47 |
0.7831 times |
Thu 16 October 2025 |
71.00 (3.26%) |
69.25 |
68.49 - 72.50 |
1.458 times |
Wed 15 October 2025 |
68.76 (-3.44%) |
71.71 |
68.70 - 71.87 |
1.5712 times |
Tue 14 October 2025 |
71.21 (2.76%) |
68.63 |
68.36 - 71.98 |
0.8096 times |
Mon 13 October 2025 |
69.30 (1.36%) |
69.40 |
68.49 - 69.80 |
0.9809 times |
Fri 10 October 2025 |
68.37 (-1.98%) |
69.82 |
67.83 - 70.03 |
0.8141 times |
Thu 09 October 2025 |
69.75 (-0.73%) |
70.12 |
69.59 - 70.83 |
0.7921 times |
Wed 08 October 2025 |
70.26 (1.8%) |
69.05 |
68.55 - 70.53 |
0.5845 times |
Tue 07 October 2025 |
69.02 (-1.4%) |
70.21 |
68.96 - 70.53 |
0.6212 times |
Weekly price and charts CooperCompanies Strong weekly Stock price targets for CooperCompanies COO are 72.87 and 75.61 | Weekly Target 1 | 72.16 | | Weekly Target 2 | 73.58 | | Weekly Target 3 | 74.9 | | Weekly Target 4 | 76.32 | | Weekly Target 5 | 77.64 |
Weekly price and volumes for Cooper Companies
| Date |
Closing |
Open |
Range |
Volume |
Tue 21 October 2025 |
75.00 (4.21%) |
76.02 |
73.48 - 76.22 |
0.4934 times |
Fri 17 October 2025 |
71.97 (5.27%) |
69.40 |
68.36 - 72.50 |
1.2527 times |
Fri 10 October 2025 |
68.37 (-2.97%) |
70.66 |
67.83 - 70.83 |
0.7181 times |
Fri 03 October 2025 |
70.46 (4.31%) |
67.73 |
66.82 - 71.02 |
0.8837 times |
Fri 26 September 2025 |
67.55 (-0.91%) |
67.68 |
66.56 - 68.46 |
1.1268 times |
Fri 19 September 2025 |
68.17 (2.23%) |
66.88 |
64.19 - 69.19 |
1.0943 times |
Fri 12 September 2025 |
66.68 (-2.07%) |
69.43 |
66.35 - 69.81 |
0.9729 times |
Fri 05 September 2025 |
68.09 (1.04%) |
66.38 |
64.89 - 69.76 |
1.0169 times |
Fri 29 August 2025 |
67.39 (-0.01%) |
65.06 |
64.82 - 67.55 |
0.3006 times |
Fri 29 August 2025 |
67.40 (-10.4%) |
75.22 |
61.78 - 75.43 |
2.1406 times |
Fri 22 August 2025 |
75.22 (2.68%) |
73.46 |
70.64 - 75.54 |
0.7751 times |
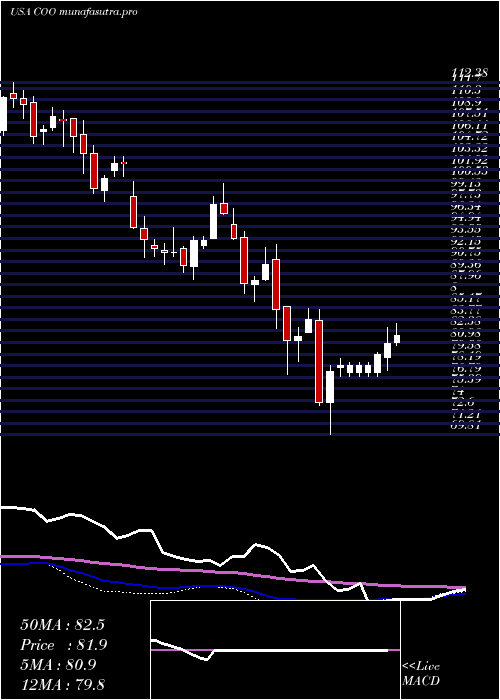
Monthly price and charts CooperCompanies Strong monthly Stock price targets for CooperCompanies COO are 70.91 and 80.31 | Monthly Target 1 | 63.28 | | Monthly Target 2 | 69.14 | | Monthly Target 3 | 72.68 | | Monthly Target 4 | 78.54 | | Monthly Target 5 | 82.08 |
Monthly price and volumes Cooper Companies
| Date |
Closing |
Open |
Range |
Volume |
Tue 21 October 2025 |
75.00 (9.39%) |
67.67 |
66.82 - 76.22 |
0.8845 times |
Tue 30 September 2025 |
68.56 (1.74%) |
66.38 |
64.19 - 69.81 |
1.2919 times |
Fri 29 August 2025 |
67.39 (-4.67%) |
70.50 |
61.78 - 75.54 |
1.2452 times |
Thu 31 July 2025 |
70.69 (-0.66%) |
71.00 |
70.47 - 77.06 |
1.129 times |
Mon 30 June 2025 |
71.16 (4.22%) |
68.37 |
65.00 - 73.47 |
1.3366 times |
Fri 30 May 2025 |
68.28 (-16.4%) |
82.91 |
65.95 - 85.23 |
1.0063 times |
Wed 30 April 2025 |
81.67 (-3.18%) |
84.19 |
69.81 - 84.19 |
0.8015 times |
Mon 31 March 2025 |
84.35 (-6.67%) |
90.97 |
77.05 - 92.84 |
1.0235 times |
Fri 28 February 2025 |
90.38 (-6.39%) |
95.26 |
85.95 - 97.21 |
0.6194 times |
Fri 31 January 2025 |
96.55 (5.03%) |
92.57 |
88.63 - 100.24 |
0.6621 times |
Tue 31 December 2024 |
91.93 (-10.43%) |
98.60 |
91.06 - 100.37 |
0.4716 times |

DMA SMA EMA moving averages of Cooper Companies COO
DMA (daily moving average) of Cooper Companies COO
| DMA period | DMA value | | 5 day DMA | 72.34 | | 12 day DMA | 70.8 | | 20 day DMA | 69.82 | | 35 day DMA | 68.72 | | 50 day DMA | 69.63 | | 100 day DMA | 70.66 | | 150 day DMA | 73.8 | | 200 day DMA | 78.11 | EMA (exponential moving average) of Cooper Companies COO
| EMA period | EMA current | EMA prev | EMA prev2 | | 5 day EMA | 73.07 | 72.1 | 70.66 | | 12 day EMA | 71.34 | 70.67 | 69.89 | | 20 day EMA | 70.46 | 69.98 | 69.45 | | 35 day EMA | 70.16 | 69.87 | 69.57 | | 50 day EMA | 69.97 | 69.76 | 69.55 |
SMA (simple moving average) of Cooper Companies COO
| SMA period | SMA current | SMA prev | SMA prev2 | | 5 day SMA | 72.34 | 71.59 | 70.45 | | 12 day SMA | 70.8 | 70.42 | 69.94 | | 20 day SMA | 69.82 | 69.44 | 69.09 | | 35 day SMA | 68.72 | 68.44 | 68.23 | | 50 day SMA | 69.63 | 69.58 | 69.5 | | 100 day SMA | 70.66 | 70.71 | 70.77 | | 150 day SMA | 73.8 | 73.83 | 73.87 | | 200 day SMA | 78.11 | 78.19 | 78.27 |
|
|
