ColumbiaBanking COLB full analysis,charts,indicators,moving averages,SMA,DMA,EMA,ADX,MACD,RSIColumbia Banking COLB WideScreen charts, DMA,SMA,EMA technical analysis, forecast prediction, by indicators ADX,MACD,RSI,CCI USA stock exchange
operates under Finance sector & deals in Major Banks
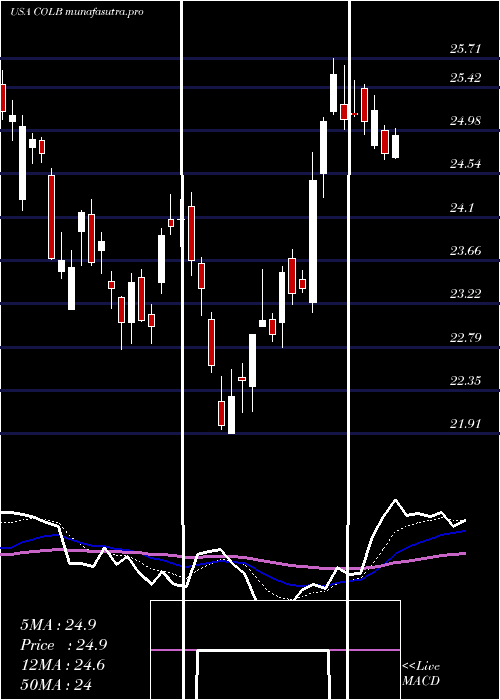
Daily price and charts and targets ColumbiaBanking Strong Daily Stock price targets for ColumbiaBanking COLB are 28.15 and 28.52 | Daily Target 1 | 27.86 | | Daily Target 2 | 28.07 | | Daily Target 3 | 28.23 | | Daily Target 4 | 28.44 | | Daily Target 5 | 28.6 |
Daily price and volume Columbia Banking
| Date |
Closing |
Open |
Range |
Volume |
Thu 04 December 2025 |
28.28 (0.39%) |
28.10 |
28.02 - 28.39 |
0.7777 times |
Wed 03 December 2025 |
28.17 (1.81%) |
27.72 |
27.72 - 28.32 |
1.5327 times |
Tue 02 December 2025 |
27.67 (-1.46%) |
28.23 |
27.66 - 28.25 |
1.1847 times |
Mon 01 December 2025 |
28.08 (1.3%) |
27.56 |
27.51 - 28.33 |
0.9677 times |
Fri 28 November 2025 |
27.72 (-2.26%) |
27.93 |
27.69 - 28.21 |
0.6671 times |
Wed 26 November 2025 |
28.36 (-0.21%) |
28.32 |
28.32 - 28.59 |
0.798 times |
Tue 25 November 2025 |
28.42 (3.2%) |
27.71 |
27.69 - 28.77 |
0.9868 times |
Mon 24 November 2025 |
27.54 (1.36%) |
27.26 |
26.96 - 27.67 |
0.9616 times |
Fri 21 November 2025 |
27.17 (3.58%) |
26.31 |
26.30 - 27.47 |
1.023 times |
Thu 20 November 2025 |
26.23 (-0.53%) |
26.63 |
26.15 - 27.16 |
1.1007 times |
Wed 19 November 2025 |
26.37 (2.21%) |
25.93 |
25.86 - 26.45 |
0.9768 times |
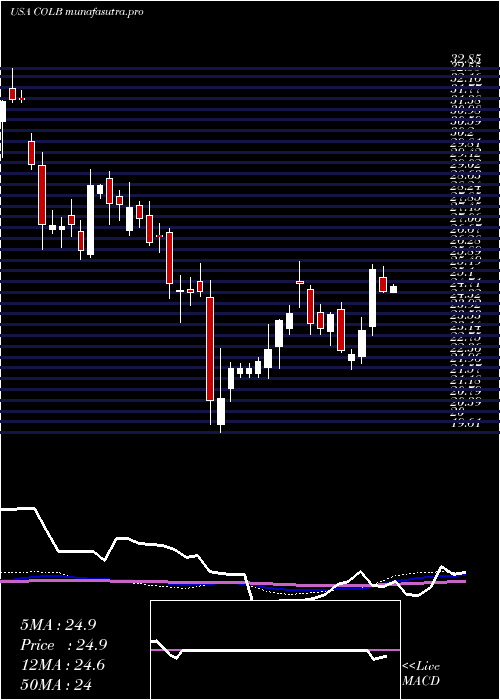
Weekly price and charts ColumbiaBanking Strong weekly Stock price targets for ColumbiaBanking COLB are 27.9 and 28.78 | Weekly Target 1 | 27.18 | | Weekly Target 2 | 27.73 | | Weekly Target 3 | 28.06 | | Weekly Target 4 | 28.61 | | Weekly Target 5 | 28.94 |
Weekly price and volumes for Columbia Banking
| Date |
Closing |
Open |
Range |
Volume |
Thu 04 December 2025 |
28.28 (2.02%) |
27.56 |
27.51 - 28.39 |
0.6316 times |
Fri 28 November 2025 |
27.72 (2.02%) |
27.26 |
26.96 - 28.77 |
0.4831 times |
Fri 21 November 2025 |
27.17 (0.89%) |
26.79 |
25.51 - 27.47 |
0.9327 times |
Fri 14 November 2025 |
26.93 (0%) |
27.05 |
26.47 - 27.41 |
0.8505 times |
Fri 07 November 2025 |
26.93 (0.49%) |
26.61 |
26.03 - 27.14 |
0.7007 times |
Fri 31 October 2025 |
26.80 (0%) |
25.69 |
25.12 - 26.97 |
0.3404 times |
Fri 31 October 2025 |
26.80 (4.93%) |
25.85 |
25.12 - 27.14 |
1.6217 times |
Fri 24 October 2025 |
25.54 (5.02%) |
24.42 |
24.42 - 25.76 |
1.1074 times |
Fri 17 October 2025 |
24.32 (-2.33%) |
25.37 |
23.83 - 26.88 |
1.7751 times |
Fri 10 October 2025 |
24.90 (-5.72%) |
26.70 |
24.90 - 27.32 |
1.5568 times |
Fri 03 October 2025 |
26.41 (1.34%) |
26.19 |
25.25 - 26.55 |
1.4153 times |
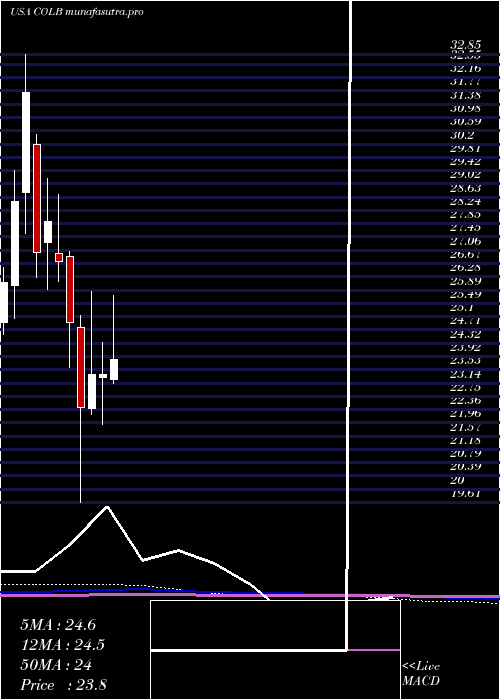
Monthly price and charts ColumbiaBanking Strong monthly Stock price targets for ColumbiaBanking COLB are 27.9 and 28.78 | Monthly Target 1 | 27.18 | | Monthly Target 2 | 27.73 | | Monthly Target 3 | 28.06 | | Monthly Target 4 | 28.61 | | Monthly Target 5 | 28.94 |
Monthly price and volumes Columbia Banking
| Date |
Closing |
Open |
Range |
Volume |
Thu 04 December 2025 |
28.28 (2.02%) |
27.56 |
27.51 - 28.39 |
0.181 times |
Fri 28 November 2025 |
27.72 (3.43%) |
26.61 |
25.51 - 28.77 |
0.85 times |
Fri 31 October 2025 |
26.80 (4.12%) |
25.61 |
23.83 - 27.32 |
2.0789 times |
Tue 30 September 2025 |
25.74 (-3.85%) |
26.50 |
25.09 - 27.48 |
1.9884 times |
Fri 29 August 2025 |
26.77 (12.48%) |
23.40 |
22.77 - 27.52 |
1.4182 times |
Thu 31 July 2025 |
23.80 (1.8%) |
23.24 |
23.14 - 25.71 |
0.9789 times |
Mon 30 June 2025 |
23.38 (0%) |
23.29 |
21.91 - 24.35 |
0.645 times |
Fri 30 May 2025 |
23.38 (4.28%) |
22.38 |
22.20 - 25.84 |
0.6473 times |
Wed 30 April 2025 |
22.42 (-10.1%) |
24.77 |
19.61 - 25.14 |
0.7085 times |
Mon 31 March 2025 |
24.94 (-6.7%) |
26.87 |
23.61 - 27.02 |
0.5039 times |
Fri 28 February 2025 |
26.73 (-4.19%) |
26.96 |
26.15 - 28.72 |
0.4008 times |
DMA SMA EMA moving averages of Columbia Banking COLB
DMA (daily moving average) of Columbia Banking COLB
| DMA period | DMA value | | 5 day DMA | 27.98 | | 12 day DMA | 27.48 | | 20 day DMA | 27.19 | | 35 day DMA | 26.58 | | 50 day DMA | 26.39 | | 100 day DMA | 25.95 | | 150 day DMA | 25.28 | | 200 day DMA | 24.95 | EMA (exponential moving average) of Columbia Banking COLB
| EMA period | EMA current | EMA prev | EMA prev2 | | 5 day EMA | 28.04 | 27.92 | 27.79 | | 12 day EMA | 27.65 | 27.54 | 27.42 | | 20 day EMA | 27.33 | 27.23 | 27.13 | | 35 day EMA | 26.92 | 26.84 | 26.76 | | 50 day EMA | 26.55 | 26.48 | 26.41 |
SMA (simple moving average) of Columbia Banking COLB
| SMA period | SMA current | SMA prev | SMA prev2 | | 5 day SMA | 27.98 | 28 | 28.05 | | 12 day SMA | 27.48 | 27.27 | 27.17 | | 20 day SMA | 27.19 | 27.11 | 27.02 | | 35 day SMA | 26.58 | 26.52 | 26.48 | | 50 day SMA | 26.39 | 26.35 | 26.31 | | 100 day SMA | 25.95 | 25.91 | 25.88 | | 150 day SMA | 25.28 | 25.24 | 25.2 | | 200 day SMA | 24.95 | 24.95 | 24.94 |
|
|
