CnxResources CNX full analysis,charts,indicators,moving averages,SMA,DMA,EMA,ADX,MACD,RSICnx Resources CNX WideScreen charts, DMA,SMA,EMA technical analysis, forecast prediction, by indicators ADX,MACD,RSI,CCI USA stock exchange
operates under Energy sector & deals in Oil Gas Production
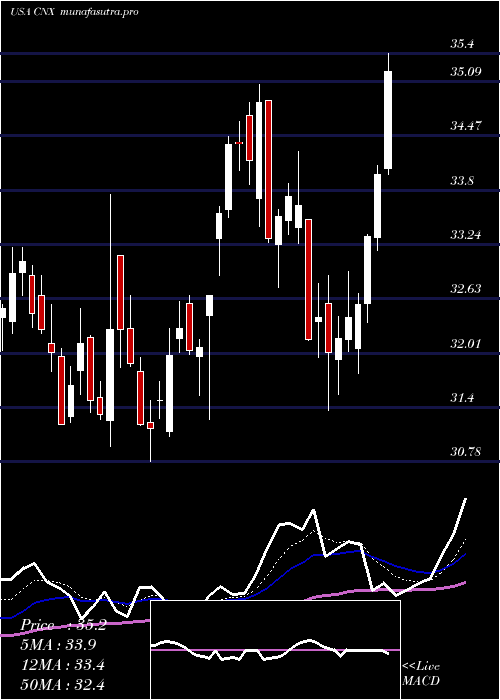
Daily price and charts and targets CnxResources Strong Daily Stock price targets for CnxResources CNX are 40.23 and 40.84 | Daily Target 1 | 39.77 | | Daily Target 2 | 40.08 | | Daily Target 3 | 40.38 | | Daily Target 4 | 40.69 | | Daily Target 5 | 40.99 |
Daily price and volume Cnx Resources
| Date |
Closing |
Open |
Range |
Volume |
Thu 04 December 2025 |
40.39 (0%) |
40.25 |
40.07 - 40.68 |
0.7836 times |
Wed 03 December 2025 |
40.39 (3.59%) |
39.29 |
39.02 - 40.45 |
1.0888 times |
Tue 02 December 2025 |
38.99 (-0.84%) |
39.28 |
38.62 - 39.32 |
0.7972 times |
Mon 01 December 2025 |
39.32 (1.24%) |
38.85 |
38.85 - 39.50 |
1.1621 times |
Fri 28 November 2025 |
38.84 (1.41%) |
38.48 |
38.37 - 39.21 |
0.4763 times |
Wed 26 November 2025 |
38.30 (2.35%) |
37.42 |
37.42 - 38.53 |
0.8133 times |
Tue 25 November 2025 |
37.42 (-0.19%) |
37.39 |
36.91 - 37.57 |
0.9353 times |
Mon 24 November 2025 |
37.49 (1.49%) |
36.61 |
36.45 - 37.78 |
1.8239 times |
Fri 21 November 2025 |
36.94 (0.49%) |
37.08 |
36.66 - 37.48 |
0.9335 times |
Thu 20 November 2025 |
36.76 (-0.57%) |
36.85 |
36.65 - 38.05 |
1.186 times |
Wed 19 November 2025 |
36.97 (-0.48%) |
36.94 |
36.78 - 37.47 |
0.7441 times |
Weekly price and charts CnxResources Strong weekly Stock price targets for CnxResources CNX are 39.51 and 41.57 | Weekly Target 1 | 37.84 | | Weekly Target 2 | 39.11 | | Weekly Target 3 | 39.896666666667 | | Weekly Target 4 | 41.17 | | Weekly Target 5 | 41.96 |
Weekly price and volumes for Cnx Resources
| Date |
Closing |
Open |
Range |
Volume |
Thu 04 December 2025 |
40.39 (3.99%) |
38.85 |
38.62 - 40.68 |
0.8304 times |
Fri 28 November 2025 |
38.84 (5.14%) |
36.61 |
36.45 - 39.21 |
0.8774 times |
Fri 21 November 2025 |
36.94 (0.44%) |
36.75 |
35.70 - 38.05 |
0.9876 times |
Fri 14 November 2025 |
36.78 (4.7%) |
35.31 |
35.14 - 37.77 |
1.039 times |
Fri 07 November 2025 |
35.13 (4.37%) |
34.17 |
33.31 - 35.36 |
0.9309 times |
Fri 31 October 2025 |
33.66 (0%) |
33.02 |
32.67 - 33.85 |
0.3896 times |
Fri 31 October 2025 |
33.66 (2.97%) |
32.81 |
31.47 - 33.85 |
1.7188 times |
Fri 24 October 2025 |
32.69 (2.19%) |
32.28 |
31.52 - 32.96 |
1.1103 times |
Fri 17 October 2025 |
31.99 (-0.03%) |
31.90 |
31.57 - 32.99 |
1.1217 times |
Fri 10 October 2025 |
32.00 (-2.68%) |
32.93 |
31.91 - 34.22 |
0.9944 times |
Fri 03 October 2025 |
32.88 (2.02%) |
32.17 |
31.79 - 33.79 |
1.1307 times |
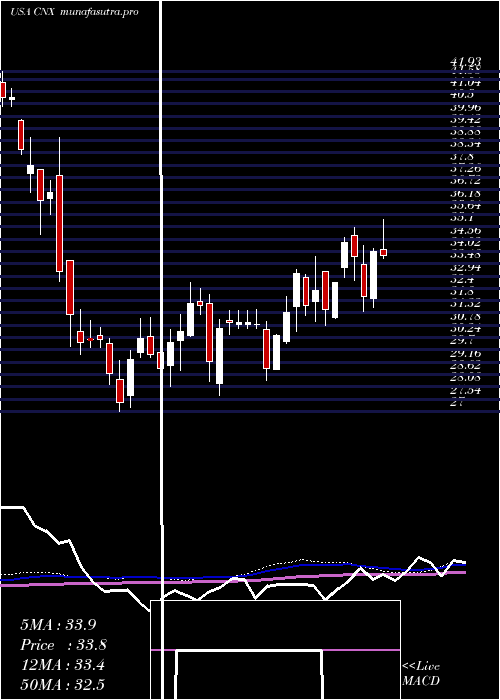
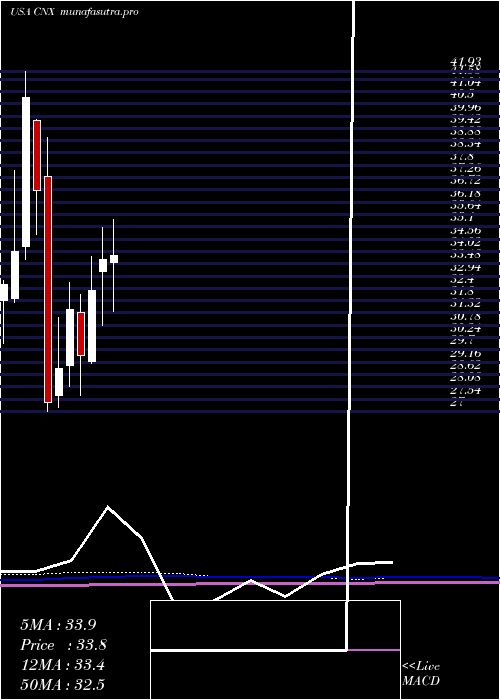
Monthly price and charts CnxResources Strong monthly Stock price targets for CnxResources CNX are 39.51 and 41.57 | Monthly Target 1 | 37.84 | | Monthly Target 2 | 39.11 | | Monthly Target 3 | 39.896666666667 | | Monthly Target 4 | 41.17 | | Monthly Target 5 | 41.96 |
Monthly price and volumes Cnx Resources
| Date |
Closing |
Open |
Range |
Volume |
Thu 04 December 2025 |
40.39 (3.99%) |
38.85 |
38.62 - 40.68 |
0.1612 times |
Fri 28 November 2025 |
38.84 (15.39%) |
34.17 |
33.31 - 39.21 |
0.7447 times |
Fri 31 October 2025 |
33.66 (4.79%) |
32.05 |
31.47 - 34.22 |
1.1522 times |
Tue 30 September 2025 |
32.12 (10%) |
28.70 |
28.70 - 32.80 |
1.0609 times |
Fri 29 August 2025 |
29.20 (-3.66%) |
30.27 |
27.72 - 30.28 |
0.8471 times |
Thu 31 July 2025 |
30.31 (-10.01%) |
33.53 |
29.77 - 35.40 |
1.3957 times |
Mon 30 June 2025 |
33.68 (4.34%) |
33.12 |
30.78 - 35.05 |
0.9478 times |
Fri 30 May 2025 |
32.28 (9.68%) |
29.19 |
29.10 - 33.81 |
1.115 times |
Wed 30 April 2025 |
29.43 (-6.51%) |
31.34 |
27.68 - 32.14 |
1.4507 times |
Mon 31 March 2025 |
31.48 (8.93%) |
29.00 |
28.11 - 32.65 |
1.1248 times |
Fri 28 February 2025 |
28.90 (5.55%) |
27.70 |
27.19 - 31.12 |
1.5735 times |
DMA SMA EMA moving averages of Cnx Resources CNX
DMA (daily moving average) of Cnx Resources CNX
| DMA period | DMA value | | 5 day DMA | 39.59 | | 12 day DMA | 38.25 | | 20 day DMA | 37.45 | | 35 day DMA | 35.4 | | 50 day DMA | 34.6 | | 100 day DMA | 32.32 | | 150 day DMA | 32.34 | | 200 day DMA | 31.82 | EMA (exponential moving average) of Cnx Resources CNX
| EMA period | EMA current | EMA prev | EMA prev2 | | 5 day EMA | 39.6 | 39.21 | 38.62 | | 12 day EMA | 38.47 | 38.12 | 37.71 | | 20 day EMA | 37.49 | 37.18 | 36.84 | | 35 day EMA | 36.14 | 35.89 | 35.63 | | 50 day EMA | 34.76 | 34.53 | 34.29 |
SMA (simple moving average) of Cnx Resources CNX
| SMA period | SMA current | SMA prev | SMA prev2 | | 5 day SMA | 39.59 | 39.17 | 38.57 | | 12 day SMA | 38.25 | 37.89 | 37.59 | | 20 day SMA | 37.45 | 37.13 | 36.83 | | 35 day SMA | 35.4 | 35.17 | 34.93 | | 50 day SMA | 34.6 | 34.42 | 34.22 | | 100 day SMA | 32.32 | 32.25 | 32.2 | | 150 day SMA | 32.34 | 32.27 | 32.2 | | 200 day SMA | 31.82 | 31.77 | 31.72 |
|
|
