CanadianNatural CNQ full analysis,charts,indicators,moving averages,SMA,DMA,EMA,ADX,MACD,RSICanadian Natural CNQ WideScreen charts, DMA,SMA,EMA technical analysis, forecast prediction, by indicators ADX,MACD,RSI,CCI USA stock exchange
operates under Energy sector & deals in Oil Gas Production
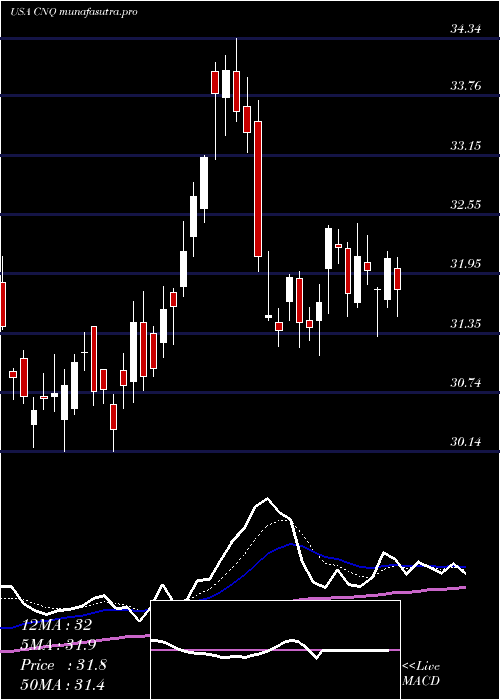
Daily price and charts and targets CanadianNatural Strong Daily Stock price targets for CanadianNatural CNQ are 34.4 and 35.15 | Daily Target 1 | 33.87 | | Daily Target 2 | 34.17 | | Daily Target 3 | 34.623333333333 | | Daily Target 4 | 34.92 | | Daily Target 5 | 35.37 |
Daily price and volume Canadian Natural
| Date |
Closing |
Open |
Range |
Volume |
Thu 04 December 2025 |
34.46 (0.97%) |
34.33 |
34.33 - 35.08 |
0.881 times |
Wed 03 December 2025 |
34.13 (1.73%) |
33.71 |
33.67 - 34.30 |
0.756 times |
Tue 02 December 2025 |
33.55 (-1.47%) |
34.00 |
33.36 - 34.06 |
0.7895 times |
Mon 01 December 2025 |
34.05 (0.83%) |
33.95 |
33.86 - 34.36 |
0.9364 times |
Fri 28 November 2025 |
33.77 (1.35%) |
33.40 |
33.26 - 33.95 |
0.3903 times |
Wed 26 November 2025 |
33.32 (0.24%) |
33.30 |
33.15 - 33.60 |
0.9897 times |
Tue 25 November 2025 |
33.24 (0.97%) |
32.71 |
32.42 - 33.25 |
0.8366 times |
Mon 24 November 2025 |
32.92 (-1.53%) |
33.45 |
32.68 - 33.53 |
0.9074 times |
Fri 21 November 2025 |
33.43 (-1.59%) |
33.78 |
33.10 - 33.91 |
1.4949 times |
Thu 20 November 2025 |
33.97 (-0.09%) |
34.16 |
33.91 - 34.97 |
2.0182 times |
Wed 19 November 2025 |
34.00 (-0.15%) |
33.37 |
33.27 - 34.09 |
1.7502 times |
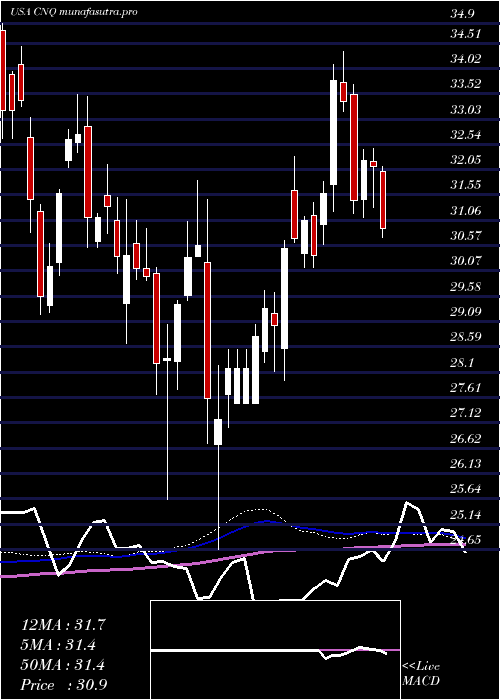
Weekly price and charts CanadianNatural Strong weekly Stock price targets for CanadianNatural CNQ are 33.91 and 35.63 | Weekly Target 1 | 32.58 | | Weekly Target 2 | 33.52 | | Weekly Target 3 | 34.3 | | Weekly Target 4 | 35.24 | | Weekly Target 5 | 36.02 |
Weekly price and volumes for Canadian Natural
| Date |
Closing |
Open |
Range |
Volume |
Thu 04 December 2025 |
34.46 (2.04%) |
33.95 |
33.36 - 35.08 |
0.7863 times |
Fri 28 November 2025 |
33.77 (1.02%) |
33.45 |
32.42 - 33.95 |
0.7304 times |
Fri 21 November 2025 |
33.43 (-0.42%) |
33.44 |
33.00 - 34.97 |
1.952 times |
Fri 14 November 2025 |
33.57 (6.03%) |
31.90 |
31.49 - 33.58 |
1.2837 times |
Fri 07 November 2025 |
31.66 (-1.12%) |
31.56 |
30.91 - 32.19 |
0.8813 times |
Fri 31 October 2025 |
32.02 (0%) |
32.03 |
31.76 - 32.27 |
0.1394 times |
Fri 31 October 2025 |
32.02 (2.4%) |
31.58 |
31.06 - 32.33 |
0.8258 times |
Fri 24 October 2025 |
31.27 (3.78%) |
30.12 |
29.68 - 31.53 |
0.7875 times |
Fri 17 October 2025 |
30.13 (-4.04%) |
31.76 |
29.94 - 31.88 |
1.0567 times |
Fri 10 October 2025 |
31.40 (-0.76%) |
32.32 |
31.40 - 33.25 |
1.5569 times |
Fri 03 October 2025 |
31.64 (-3.21%) |
32.53 |
31.44 - 32.57 |
1.1602 times |
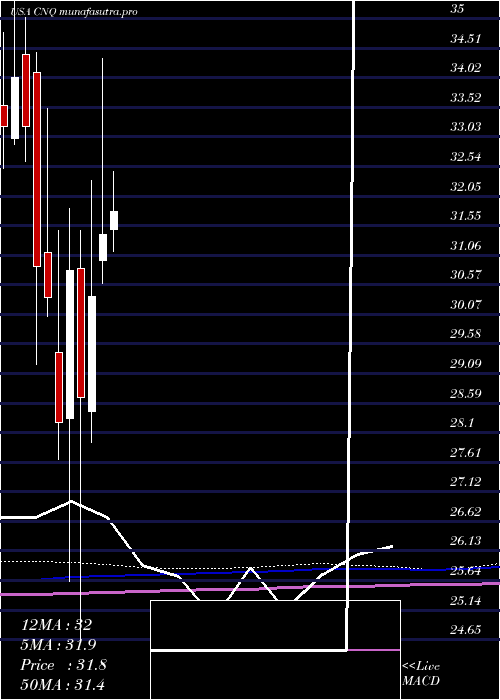
Monthly price and charts CanadianNatural Strong monthly Stock price targets for CanadianNatural CNQ are 33.91 and 35.63 | Monthly Target 1 | 32.58 | | Monthly Target 2 | 33.52 | | Monthly Target 3 | 34.3 | | Monthly Target 4 | 35.24 | | Monthly Target 5 | 36.02 |
Monthly price and volumes Canadian Natural
| Date |
Closing |
Open |
Range |
Volume |
Thu 04 December 2025 |
34.46 (2.04%) |
33.95 |
33.36 - 35.08 |
0.1757 times |
Fri 28 November 2025 |
33.77 (5.47%) |
31.56 |
30.91 - 34.97 |
1.0835 times |
Fri 31 October 2025 |
32.02 (0.19%) |
31.87 |
29.68 - 33.25 |
1.1053 times |
Tue 30 September 2025 |
31.96 (0.98%) |
31.52 |
30.19 - 33.24 |
1.3423 times |
Fri 29 August 2025 |
31.65 (-0.16%) |
31.64 |
29.30 - 32.08 |
0.9902 times |
Thu 31 July 2025 |
31.70 (0.96%) |
31.48 |
30.53 - 32.46 |
0.7537 times |
Mon 30 June 2025 |
31.40 (3.39%) |
30.97 |
30.58 - 34.34 |
1.1714 times |
Fri 30 May 2025 |
30.37 (5.86%) |
28.45 |
27.93 - 32.30 |
0.9279 times |
Wed 30 April 2025 |
28.69 (-6.85%) |
30.83 |
24.65 - 31.47 |
1.101 times |
Mon 31 March 2025 |
30.80 (8.95%) |
28.33 |
25.62 - 31.84 |
1.3491 times |
Fri 28 February 2025 |
28.27 (-6.85%) |
29.44 |
27.66 - 31.47 |
0.9822 times |
DMA SMA EMA moving averages of Canadian Natural CNQ
DMA (daily moving average) of Canadian Natural CNQ
| DMA period | DMA value | | 5 day DMA | 33.99 | | 12 day DMA | 33.74 | | 20 day DMA | 33.22 | | 35 day DMA | 32.34 | | 50 day DMA | 32.23 | | 100 day DMA | 31.68 | | 150 day DMA | 31.56 | | 200 day DMA | 30.9 | EMA (exponential moving average) of Canadian Natural CNQ
| EMA period | EMA current | EMA prev | EMA prev2 | | 5 day EMA | 34.02 | 33.8 | 33.63 | | 12 day EMA | 33.65 | 33.5 | 33.39 | | 20 day EMA | 33.28 | 33.16 | 33.06 | | 35 day EMA | 32.87 | 32.78 | 32.7 | | 50 day EMA | 32.4 | 32.32 | 32.25 |
SMA (simple moving average) of Canadian Natural CNQ
| SMA period | SMA current | SMA prev | SMA prev2 | | 5 day SMA | 33.99 | 33.76 | 33.59 | | 12 day SMA | 33.74 | 33.65 | 33.6 | | 20 day SMA | 33.22 | 33.09 | 32.95 | | 35 day SMA | 32.34 | 32.23 | 32.14 | | 50 day SMA | 32.23 | 32.2 | 32.16 | | 100 day SMA | 31.68 | 31.65 | 31.63 | | 150 day SMA | 31.56 | 31.53 | 31.49 | | 200 day SMA | 30.9 | 30.88 | 30.86 |
|
|
