ConmedCorporation CNMD full analysis,charts,indicators,moving averages,SMA,DMA,EMA,ADX,MACD,RSIConmed Corporation CNMD WideScreen charts, DMA,SMA,EMA technical analysis, forecast prediction, by indicators ADX,MACD,RSI,CCI USA stock exchange
operates under Health Care sector & deals in Biotechnology Electromedical Electrotherapeutic Apparatus
Daily price and charts and targets ConmedCorporation Strong Daily Stock price targets for ConmedCorporation CNMD are 43.4 and 44.56 | Daily Target 1 | 43.12 | | Daily Target 2 | 43.68 | | Daily Target 3 | 44.28 | | Daily Target 4 | 44.84 | | Daily Target 5 | 45.44 |
Daily price and volume Conmed Corporation
| Date |
Closing |
Open |
Range |
Volume |
Thu 04 December 2025 |
44.24 (-0.25%) |
44.36 |
43.72 - 44.88 |
0.8867 times |
Wed 03 December 2025 |
44.35 (0.73%) |
44.40 |
43.98 - 44.98 |
0.828 times |
Tue 02 December 2025 |
44.03 (-1.06%) |
44.54 |
43.38 - 44.73 |
0.7966 times |
Mon 01 December 2025 |
44.50 (2.49%) |
43.20 |
43.08 - 45.52 |
1.2114 times |
Fri 28 November 2025 |
43.42 (-0.78%) |
43.76 |
43.26 - 43.96 |
0.4916 times |
Wed 26 November 2025 |
43.76 (1.16%) |
43.31 |
42.50 - 44.17 |
0.8337 times |
Tue 25 November 2025 |
43.26 (-0.09%) |
42.86 |
42.86 - 44.06 |
1.1438 times |
Mon 24 November 2025 |
43.30 (1.22%) |
42.87 |
42.37 - 43.40 |
1.4489 times |
Fri 21 November 2025 |
42.78 (5.29%) |
41.21 |
40.75 - 43.49 |
1.2727 times |
Thu 20 November 2025 |
40.63 (0.3%) |
40.70 |
40.16 - 41.37 |
1.0867 times |
Wed 19 November 2025 |
40.51 (-3.18%) |
41.80 |
40.25 - 41.84 |
1.0101 times |
Weekly price and charts ConmedCorporation Strong weekly Stock price targets for ConmedCorporation CNMD are 43.66 and 46.1 | Weekly Target 1 | 41.84 | | Weekly Target 2 | 43.04 | | Weekly Target 3 | 44.28 | | Weekly Target 4 | 45.48 | | Weekly Target 5 | 46.72 |
Weekly price and volumes for Conmed Corporation
| Date |
Closing |
Open |
Range |
Volume |
Thu 04 December 2025 |
44.24 (1.89%) |
43.20 |
43.08 - 45.52 |
1.0165 times |
Fri 28 November 2025 |
43.42 (1.5%) |
42.87 |
42.37 - 44.17 |
1.0698 times |
Fri 21 November 2025 |
42.78 (1.76%) |
42.13 |
40.16 - 43.49 |
1.4589 times |
Fri 14 November 2025 |
42.04 (-4.39%) |
43.64 |
41.41 - 45.55 |
1.2173 times |
Fri 07 November 2025 |
43.97 (-0.07%) |
44.55 |
41.62 - 46.23 |
1.2477 times |
Fri 31 October 2025 |
44.00 (0%) |
44.01 |
43.51 - 44.86 |
0.3547 times |
Fri 31 October 2025 |
44.00 (-7.87%) |
48.43 |
43.51 - 48.43 |
1.1339 times |
Fri 24 October 2025 |
47.76 (5.69%) |
45.76 |
45.71 - 49.62 |
1.0282 times |
Fri 17 October 2025 |
45.19 (5.88%) |
43.19 |
42.51 - 45.57 |
0.7577 times |
Fri 10 October 2025 |
42.68 (-11.32%) |
48.24 |
42.50 - 48.41 |
0.7153 times |
Fri 03 October 2025 |
48.13 (4.63%) |
45.94 |
45.18 - 48.44 |
1.0271 times |
Monthly price and charts ConmedCorporation Strong monthly Stock price targets for ConmedCorporation CNMD are 43.66 and 46.1 | Monthly Target 1 | 41.84 | | Monthly Target 2 | 43.04 | | Monthly Target 3 | 44.28 | | Monthly Target 4 | 45.48 | | Monthly Target 5 | 46.72 |
Monthly price and volumes Conmed Corporation
| Date |
Closing |
Open |
Range |
Volume |
Thu 04 December 2025 |
44.24 (1.89%) |
43.20 |
43.08 - 45.52 |
0.2207 times |
Fri 28 November 2025 |
43.42 (-1.32%) |
44.55 |
40.16 - 46.23 |
1.0843 times |
Fri 31 October 2025 |
44.00 (-6.44%) |
46.88 |
42.50 - 49.62 |
0.9934 times |
Tue 30 September 2025 |
47.03 (-13.48%) |
53.54 |
45.06 - 56.63 |
0.9906 times |
Fri 29 August 2025 |
54.36 (6.28%) |
50.90 |
49.92 - 56.12 |
1.1248 times |
Thu 31 July 2025 |
51.15 (-1.79%) |
51.95 |
47.33 - 55.30 |
1.2809 times |
Mon 30 June 2025 |
52.08 (-8.23%) |
56.39 |
50.80 - 60.35 |
0.8786 times |
Fri 30 May 2025 |
56.75 (15.56%) |
55.00 |
54.62 - 61.08 |
1.0035 times |
Wed 30 April 2025 |
49.11 (-18.68%) |
60.05 |
46.00 - 61.13 |
1.3126 times |
Mon 31 March 2025 |
60.39 (2.06%) |
59.43 |
55.22 - 64.87 |
1.1105 times |
Fri 28 February 2025 |
59.17 (-17.57%) |
70.33 |
58.73 - 74.70 |
1.299 times |

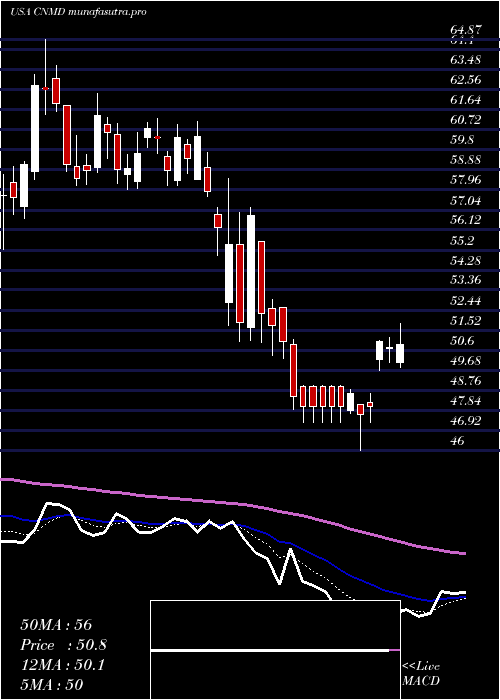
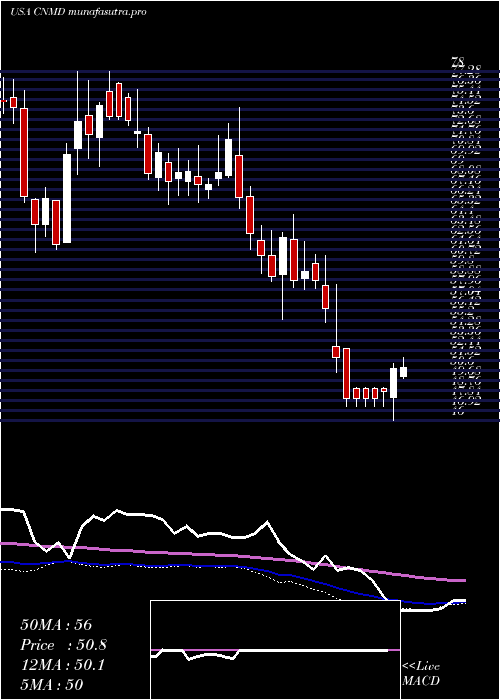
DMA SMA EMA moving averages of Conmed Corporation CNMD
DMA (daily moving average) of Conmed Corporation CNMD
| DMA period | DMA value | | 5 day DMA | 44.11 | | 12 day DMA | 43.05 | | 20 day DMA | 43.2 | | 35 day DMA | 44.55 | | 50 day DMA | 44.9 | | 100 day DMA | 48.56 | | 150 day DMA | 50.88 | | 200 day DMA | 52.17 | EMA (exponential moving average) of Conmed Corporation CNMD
| EMA period | EMA current | EMA prev | EMA prev2 | | 5 day EMA | 44.04 | 43.94 | 43.74 | | 12 day EMA | 43.65 | 43.54 | 43.39 | | 20 day EMA | 43.76 | 43.71 | 43.64 | | 35 day EMA | 44.32 | 44.32 | 44.32 | | 50 day EMA | 45.22 | 45.26 | 45.3 |
SMA (simple moving average) of Conmed Corporation CNMD
| SMA period | SMA current | SMA prev | SMA prev2 | | 5 day SMA | 44.11 | 44.01 | 43.79 | | 12 day SMA | 43.05 | 42.83 | 42.64 | | 20 day SMA | 43.2 | 43.21 | 43.28 | | 35 day SMA | 44.55 | 44.55 | 44.56 | | 50 day SMA | 44.9 | 44.99 | 45.07 | | 100 day SMA | 48.56 | 48.6 | 48.66 | | 150 day SMA | 50.88 | 50.91 | 50.96 | | 200 day SMA | 52.17 | 52.26 | 52.36 |
|
|
