ConduentIncorporated CNDT full analysis,charts,indicators,moving averages,SMA,DMA,EMA,ADX,MACD,RSIConduent Incorporated CNDT WideScreen charts, DMA,SMA,EMA technical analysis, forecast prediction, by indicators ADX,MACD,RSI,CCI USA stock exchange
operates under Miscellaneous sector & deals in Business Services
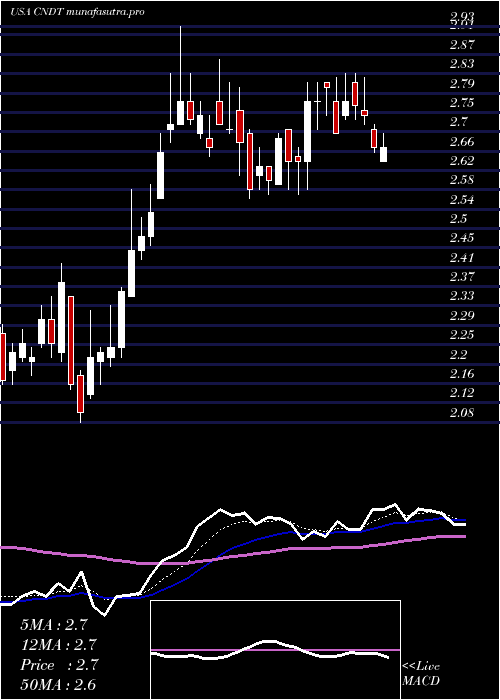
Daily price and charts and targets ConduentIncorporated Strong Daily Stock price targets for ConduentIncorporated CNDT are 2.48 and 2.53 | Daily Target 1 | 2.44 | | Daily Target 2 | 2.46 | | Daily Target 3 | 2.4866666666667 | | Daily Target 4 | 2.51 | | Daily Target 5 | 2.54 |
Daily price and volume Conduent Incorporated
| Date |
Closing |
Open |
Range |
Volume |
Mon 20 October 2025 |
2.49 (2.47%) |
2.47 |
2.46 - 2.51 |
0.7857 times |
Fri 17 October 2025 |
2.43 (-1.22%) |
2.44 |
2.38 - 2.50 |
0.7298 times |
Thu 16 October 2025 |
2.46 (-1.6%) |
2.50 |
2.43 - 2.55 |
1.1463 times |
Wed 15 October 2025 |
2.50 (3.73%) |
2.44 |
2.43 - 2.50 |
1.0122 times |
Tue 14 October 2025 |
2.41 (-2.43%) |
2.41 |
2.39 - 2.51 |
1.4278 times |
Mon 13 October 2025 |
2.47 (-0.4%) |
2.53 |
2.36 - 2.55 |
1.2103 times |
Fri 10 October 2025 |
2.48 (-7.12%) |
2.65 |
2.47 - 2.67 |
1.383 times |
Thu 09 October 2025 |
2.67 (-3.61%) |
2.74 |
2.67 - 2.76 |
0.8818 times |
Wed 08 October 2025 |
2.77 (3.36%) |
2.69 |
2.69 - 2.78 |
0.6351 times |
Tue 07 October 2025 |
2.68 (-1.83%) |
2.75 |
2.67 - 2.80 |
0.788 times |
Mon 06 October 2025 |
2.73 (-0.73%) |
2.76 |
2.72 - 2.78 |
0.4883 times |
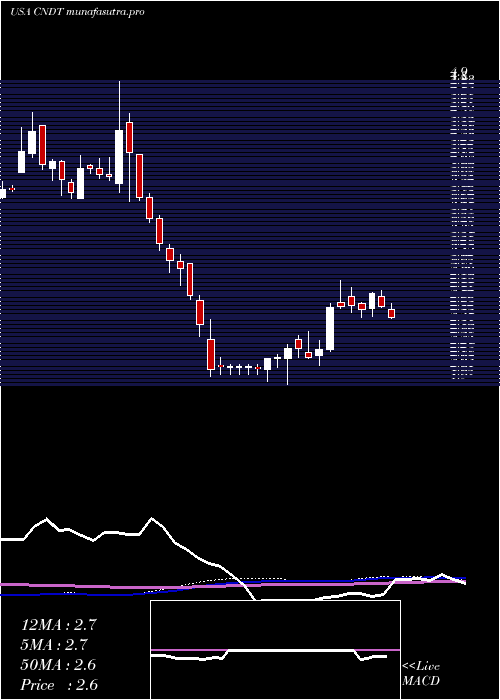
Weekly price and charts ConduentIncorporated Strong weekly Stock price targets for ConduentIncorporated CNDT are 2.48 and 2.53 | Weekly Target 1 | 2.44 | | Weekly Target 2 | 2.46 | | Weekly Target 3 | 2.4866666666667 | | Weekly Target 4 | 2.51 | | Weekly Target 5 | 2.54 |
Weekly price and volumes for Conduent Incorporated
| Date |
Closing |
Open |
Range |
Volume |
Mon 20 October 2025 |
2.49 (2.47%) |
2.47 |
2.46 - 2.51 |
0.2356 times |
Fri 17 October 2025 |
2.43 (-2.02%) |
2.53 |
2.36 - 2.55 |
1.6569 times |
Fri 10 October 2025 |
2.48 (-9.82%) |
2.76 |
2.47 - 2.80 |
1.2521 times |
Fri 03 October 2025 |
2.75 (-3.17%) |
2.85 |
2.71 - 2.85 |
0.9023 times |
Fri 26 September 2025 |
2.84 (0%) |
2.82 |
2.64 - 2.92 |
1.1465 times |
Fri 19 September 2025 |
2.84 (0.71%) |
2.82 |
2.73 - 2.98 |
1.7616 times |
Fri 12 September 2025 |
2.82 (-0.35%) |
2.85 |
2.76 - 2.92 |
1.0533 times |
Fri 05 September 2025 |
2.83 (1.8%) |
2.72 |
2.71 - 2.88 |
0.6777 times |
Fri 29 August 2025 |
2.78 (0%) |
2.81 |
2.76 - 2.83 |
0.1424 times |
Fri 29 August 2025 |
2.78 (-0.71%) |
2.79 |
2.74 - 2.94 |
1.1716 times |
Fri 22 August 2025 |
2.80 (15.23%) |
2.43 |
2.43 - 2.82 |
1.1714 times |
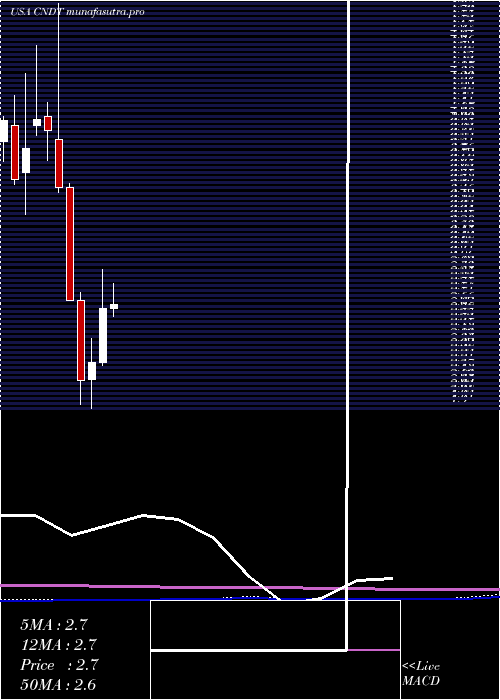
Monthly price and charts ConduentIncorporated Strong monthly Stock price targets for ConduentIncorporated CNDT are 2.19 and 2.66 | Monthly Target 1 | 2.09 | | Monthly Target 2 | 2.29 | | Monthly Target 3 | 2.56 | | Monthly Target 4 | 2.76 | | Monthly Target 5 | 3.03 |
Monthly price and volumes Conduent Incorporated
| Date |
Closing |
Open |
Range |
Volume |
Mon 20 October 2025 |
2.49 (-11.07%) |
2.76 |
2.36 - 2.83 |
0.6491 times |
Tue 30 September 2025 |
2.80 (0.72%) |
2.72 |
2.64 - 2.98 |
0.8791 times |
Fri 29 August 2025 |
2.78 (4.51%) |
2.61 |
2.34 - 2.94 |
1.04 times |
Thu 31 July 2025 |
2.66 (0.76%) |
2.64 |
2.55 - 2.85 |
0.8375 times |
Mon 30 June 2025 |
2.64 (17.86%) |
2.24 |
2.22 - 2.93 |
1.3354 times |
Fri 30 May 2025 |
2.24 (6.16%) |
2.12 |
1.90 - 2.42 |
1.469 times |
Wed 30 April 2025 |
2.11 (-21.85%) |
2.70 |
1.93 - 2.76 |
1.2943 times |
Mon 31 March 2025 |
2.70 (-23.73%) |
3.54 |
2.70 - 3.57 |
0.9304 times |
Fri 28 February 2025 |
3.54 (-10.61%) |
3.89 |
3.50 - 4.90 |
0.9319 times |
Fri 31 January 2025 |
3.96 (-1.98%) |
4.06 |
3.74 - 4.17 |
0.6331 times |
Tue 31 December 2024 |
4.04 (5.48%) |
4.00 |
3.92 - 4.59 |
1.0194 times |
DMA SMA EMA moving averages of Conduent Incorporated CNDT
DMA (daily moving average) of Conduent Incorporated CNDT
| DMA period | DMA value | | 5 day DMA | 2.46 | | 12 day DMA | 2.57 | | 20 day DMA | 2.66 | | 35 day DMA | 2.73 | | 50 day DMA | 2.71 | | 100 day DMA | 2.67 | | 150 day DMA | 2.55 | | 200 day DMA | 2.87 | EMA (exponential moving average) of Conduent Incorporated CNDT
| EMA period | EMA current | EMA prev | EMA prev2 | | 5 day EMA | 2.48 | 2.47 | 2.49 | | 12 day EMA | 2.56 | 2.57 | 2.59 | | 20 day EMA | 2.61 | 2.62 | 2.64 | | 35 day EMA | 2.65 | 2.66 | 2.67 | | 50 day EMA | 2.66 | 2.67 | 2.68 |
SMA (simple moving average) of Conduent Incorporated CNDT
| SMA period | SMA current | SMA prev | SMA prev2 | | 5 day SMA | 2.46 | 2.45 | 2.46 | | 12 day SMA | 2.57 | 2.59 | 2.62 | | 20 day SMA | 2.66 | 2.68 | 2.7 | | 35 day SMA | 2.73 | 2.74 | 2.75 | | 50 day SMA | 2.71 | 2.71 | 2.71 | | 100 day SMA | 2.67 | 2.66 | 2.66 | | 150 day SMA | 2.55 | 2.55 | 2.56 | | 200 day SMA | 2.87 | 2.87 | 2.88 |
|
|
