CmeGroup CME full analysis,charts,indicators,moving averages,SMA,DMA,EMA,ADX,MACD,RSICme Group CME WideScreen charts, DMA,SMA,EMA technical analysis, forecast prediction, by indicators ADX,MACD,RSI,CCI USA stock exchange
operates under Finance sector & deals in Investment Bankers Brokers Service
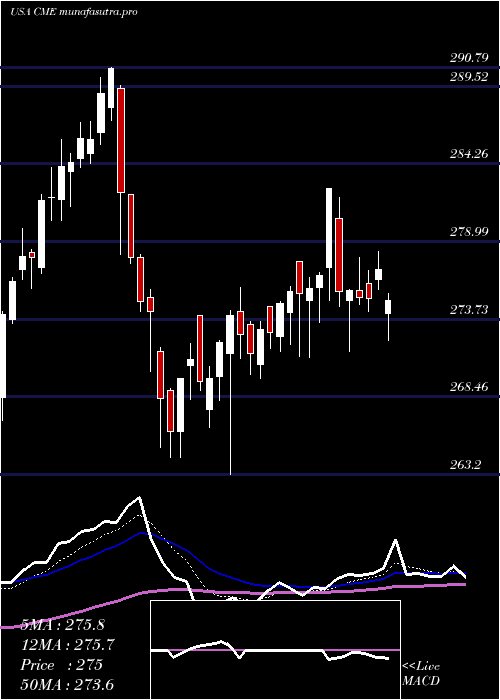
Daily price and charts and targets CmeGroup Strong Daily Stock price targets for CmeGroup CME are 268.6 and 272.37 | Daily Target 1 | 267.84 | | Daily Target 2 | 269.36 | | Daily Target 3 | 271.61333333333 | | Daily Target 4 | 273.13 | | Daily Target 5 | 275.38 |
Daily price and volume Cme Group
| Date |
Closing |
Open |
Range |
Volume |
Fri 05 December 2025 |
270.87 (-0.85%) |
273.35 |
270.10 - 273.87 |
1.0122 times |
Thu 04 December 2025 |
273.19 (-0.42%) |
275.96 |
271.61 - 276.25 |
1.2406 times |
Wed 03 December 2025 |
274.34 (-1.14%) |
276.05 |
273.12 - 279.81 |
0.9499 times |
Tue 02 December 2025 |
277.49 (-0.54%) |
278.89 |
274.99 - 280.53 |
0.9622 times |
Mon 01 December 2025 |
278.99 (-0.88%) |
281.77 |
278.13 - 282.99 |
0.8746 times |
Fri 28 November 2025 |
281.46 (0.21%) |
280.89 |
280.66 - 283.06 |
0.4547 times |
Wed 26 November 2025 |
280.87 (1.4%) |
278.01 |
277.14 - 281.97 |
0.7402 times |
Tue 25 November 2025 |
276.98 (0.47%) |
273.01 |
273.01 - 277.64 |
0.7787 times |
Mon 24 November 2025 |
275.68 (0.95%) |
273.39 |
271.04 - 276.13 |
1.8308 times |
Fri 21 November 2025 |
273.09 (-0.77%) |
277.02 |
272.06 - 277.52 |
1.156 times |
Thu 20 November 2025 |
275.22 (1%) |
272.31 |
271.16 - 276.19 |
1.0479 times |
Weekly price and charts CmeGroup Strong weekly Stock price targets for CmeGroup CME are 264.04 and 276.93 | Weekly Target 1 | 261.76 | | Weekly Target 2 | 266.32 | | Weekly Target 3 | 274.65333333333 | | Weekly Target 4 | 279.21 | | Weekly Target 5 | 287.54 |
Weekly price and volumes for Cme Group
| Date |
Closing |
Open |
Range |
Volume |
Fri 05 December 2025 |
270.87 (-3.76%) |
281.77 |
270.10 - 282.99 |
1.1597 times |
Fri 28 November 2025 |
281.46 (3.06%) |
273.39 |
271.04 - 283.06 |
0.8755 times |
Fri 21 November 2025 |
273.09 (-4.19%) |
285.48 |
269.47 - 286.33 |
1.3937 times |
Fri 14 November 2025 |
285.04 (3.09%) |
274.70 |
270.62 - 287.74 |
1.1692 times |
Fri 07 November 2025 |
276.50 (4.15%) |
267.34 |
264.16 - 279.02 |
0.8569 times |
Fri 31 October 2025 |
265.49 (0%) |
262.89 |
262.29 - 266.49 |
0.1946 times |
Fri 31 October 2025 |
265.49 (-1.5%) |
269.00 |
257.17 - 273.39 |
1.1288 times |
Fri 24 October 2025 |
269.54 (0.6%) |
267.50 |
262.34 - 273.34 |
0.9772 times |
Fri 17 October 2025 |
267.93 (-1.3%) |
268.29 |
261.80 - 275.37 |
1.0195 times |
Fri 10 October 2025 |
271.45 (2.56%) |
264.12 |
258.19 - 274.00 |
1.225 times |
Fri 03 October 2025 |
264.67 (-2.08%) |
271.27 |
262.26 - 274.17 |
1.1001 times |
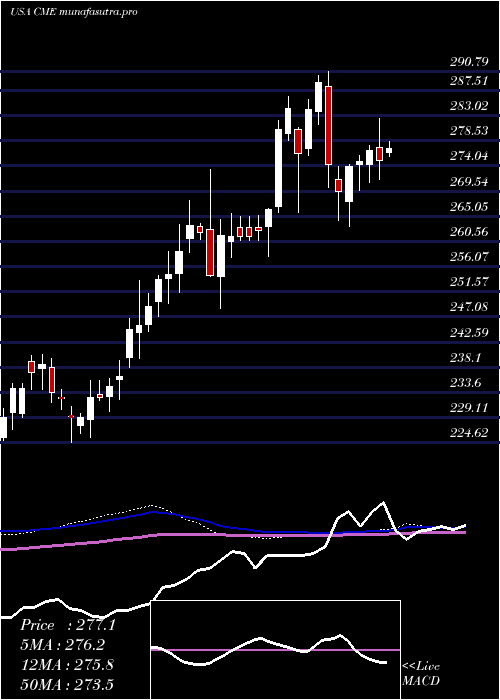
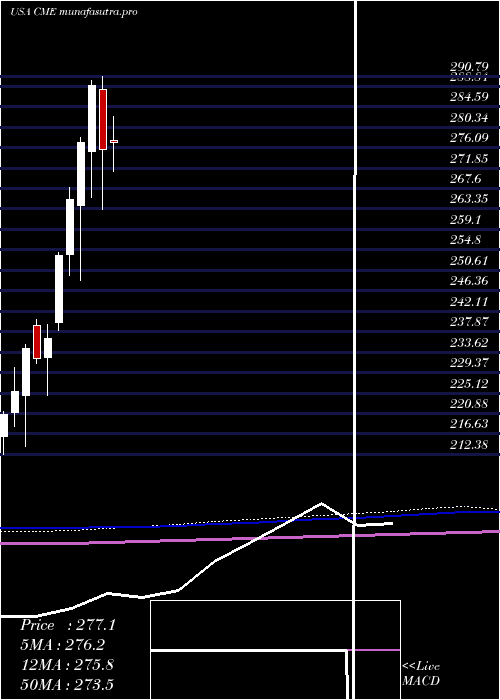
Monthly price and charts CmeGroup Strong monthly Stock price targets for CmeGroup CME are 264.04 and 276.93 | Monthly Target 1 | 261.76 | | Monthly Target 2 | 266.32 | | Monthly Target 3 | 274.65333333333 | | Monthly Target 4 | 279.21 | | Monthly Target 5 | 287.54 |
Monthly price and volumes Cme Group
| Date |
Closing |
Open |
Range |
Volume |
Fri 05 December 2025 |
270.87 (-3.76%) |
281.77 |
270.10 - 282.99 |
0.2293 times |
Fri 28 November 2025 |
281.46 (6.02%) |
267.34 |
264.16 - 287.74 |
0.8492 times |
Fri 31 October 2025 |
265.49 (-1.74%) |
270.19 |
257.17 - 275.37 |
1.0158 times |
Tue 30 September 2025 |
270.19 (1.38%) |
266.88 |
257.88 - 274.17 |
0.94 times |
Fri 29 August 2025 |
266.51 (-4.23%) |
280.79 |
265.54 - 288.28 |
0.9365 times |
Thu 31 July 2025 |
278.28 (0.97%) |
277.64 |
271.12 - 282.57 |
1.0925 times |
Mon 30 June 2025 |
275.62 (-4.63%) |
288.10 |
263.20 - 290.79 |
1.2017 times |
Fri 30 May 2025 |
289.00 (4.3%) |
275.27 |
265.72 - 290.10 |
1.0677 times |
Wed 30 April 2025 |
277.08 (4.44%) |
263.98 |
248.53 - 278.16 |
1.4076 times |
Mon 31 March 2025 |
265.29 (4.54%) |
253.90 |
249.51 - 267.91 |
1.2598 times |
Fri 28 February 2025 |
253.77 (7.29%) |
239.80 |
238.12 - 254.40 |
0.7425 times |
DMA SMA EMA moving averages of Cme Group CME
DMA (daily moving average) of Cme Group CME
| DMA period | DMA value | | 5 day DMA | 274.98 | | 12 day DMA | 275.89 | | 20 day DMA | 277.49 | | 35 day DMA | 273.15 | | 50 day DMA | 271.38 | | 100 day DMA | 271.07 | | 150 day DMA | 273.01 | | 200 day DMA | 269.74 | EMA (exponential moving average) of Cme Group CME
| EMA period | EMA current | EMA prev | EMA prev2 | | 5 day EMA | 274.15 | 275.79 | 277.09 | | 12 day EMA | 275.63 | 276.49 | 277.09 | | 20 day EMA | 275.27 | 275.73 | 276 | | 35 day EMA | 273.72 | 273.89 | 273.93 | | 50 day EMA | 271.06 | 271.07 | 270.98 |
SMA (simple moving average) of Cme Group CME
| SMA period | SMA current | SMA prev | SMA prev2 | | 5 day SMA | 274.98 | 277.09 | 278.63 | | 12 day SMA | 275.89 | 276.59 | 277.09 | | 20 day SMA | 277.49 | 277.52 | 277.26 | | 35 day SMA | 273.15 | 272.91 | 272.77 | | 50 day SMA | 271.38 | 271.33 | 271.16 | | 100 day SMA | 271.07 | 271.14 | 271.16 | | 150 day SMA | 273.01 | 273.05 | 273.07 | | 200 day SMA | 269.74 | 269.63 | 269.49 |
|
|
