CheetahMobile CMCM full analysis,charts,indicators,moving averages,SMA,DMA,EMA,ADX,MACD,RSICheetah Mobile CMCM WideScreen charts, DMA,SMA,EMA technical analysis, forecast prediction, by indicators ADX,MACD,RSI,CCI USA stock exchange
operates under Technology sector & deals in Computer Software Prepackaged Software
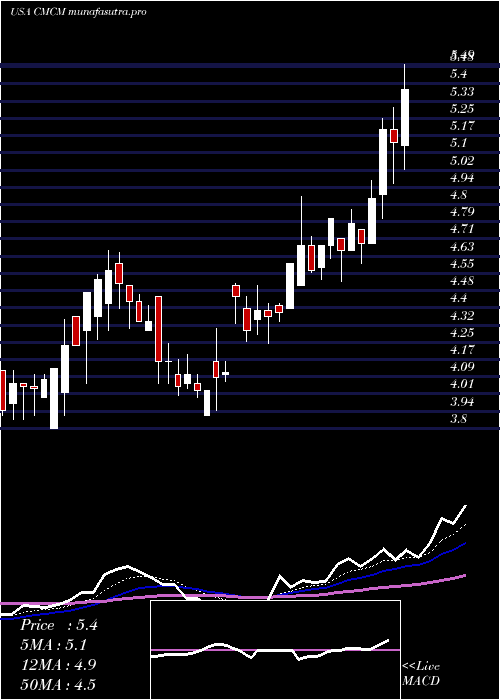
Daily price and charts and targets CheetahMobile Strong Daily Stock price targets for CheetahMobile CMCM are 7.57 and 7.93 | Daily Target 1 | 7.29 | | Daily Target 2 | 7.49 | | Daily Target 3 | 7.6533333333333 | | Daily Target 4 | 7.85 | | Daily Target 5 | 8.01 |
Daily price and volume Cheetah Mobile
| Date |
Closing |
Open |
Range |
Volume |
Mon 20 October 2025 |
7.68 (3.92%) |
7.46 |
7.46 - 7.82 |
0.7218 times |
Fri 17 October 2025 |
7.39 (0.14%) |
7.22 |
7.12 - 7.66 |
1.1715 times |
Thu 16 October 2025 |
7.38 (-6.11%) |
7.92 |
7.20 - 8.10 |
1.0847 times |
Wed 15 October 2025 |
7.86 (-2%) |
8.23 |
7.85 - 8.36 |
0.8421 times |
Tue 14 October 2025 |
8.02 (2.04%) |
7.81 |
7.75 - 8.23 |
0.9151 times |
Mon 13 October 2025 |
7.86 (-8.18%) |
7.42 |
7.42 - 8.41 |
2.2266 times |
Tue 07 October 2025 |
8.56 (-3.06%) |
8.77 |
8.40 - 9.15 |
1.2484 times |
Mon 06 October 2025 |
8.83 (7.42%) |
8.22 |
8.22 - 8.87 |
0.4406 times |
Fri 03 October 2025 |
8.22 (-1.67%) |
8.42 |
8.10 - 8.43 |
0.6232 times |
Thu 02 October 2025 |
8.36 (0.72%) |
8.41 |
8.18 - 8.65 |
0.7259 times |
Wed 01 October 2025 |
8.30 (2.98%) |
8.06 |
8.06 - 8.35 |
0.2958 times |
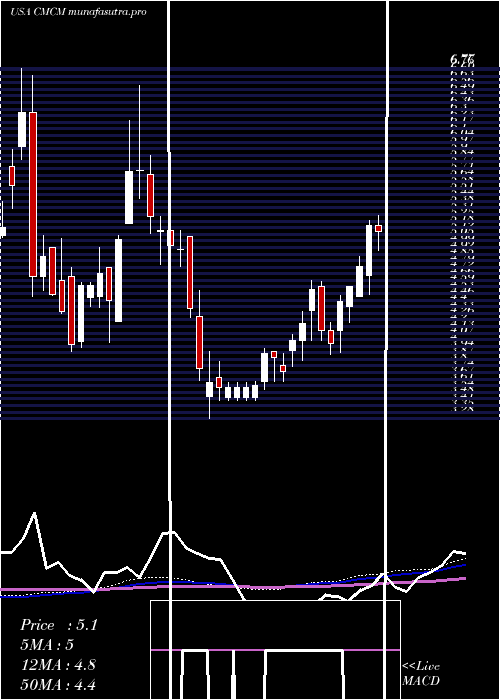
Weekly price and charts CheetahMobile Strong weekly Stock price targets for CheetahMobile CMCM are 7.57 and 7.93 | Weekly Target 1 | 7.29 | | Weekly Target 2 | 7.49 | | Weekly Target 3 | 7.6533333333333 | | Weekly Target 4 | 7.85 | | Weekly Target 5 | 8.01 |
Weekly price and volumes for Cheetah Mobile
| Date |
Closing |
Open |
Range |
Volume |
Mon 20 October 2025 |
7.68 (3.92%) |
7.46 |
7.46 - 7.82 |
0.1339 times |
Fri 17 October 2025 |
7.39 (-13.67%) |
7.42 |
7.12 - 8.41 |
1.1579 times |
Tue 07 October 2025 |
8.56 (4.14%) |
8.22 |
8.22 - 9.15 |
0.3134 times |
Fri 03 October 2025 |
8.22 (1.23%) |
8.30 |
7.84 - 8.65 |
0.692 times |
Fri 26 September 2025 |
8.12 (0.12%) |
8.20 |
8.01 - 9.44 |
1.3189 times |
Fri 19 September 2025 |
8.11 (-1.22%) |
8.16 |
7.76 - 8.99 |
1.2281 times |
Fri 12 September 2025 |
8.21 (28.28%) |
6.45 |
6.45 - 9.39 |
3.7546 times |
Fri 05 September 2025 |
6.40 (6.49%) |
5.79 |
5.79 - 6.48 |
0.6719 times |
Fri 29 August 2025 |
6.01 (0%) |
5.60 |
5.58 - 6.09 |
0.1464 times |
Fri 29 August 2025 |
6.01 (3.09%) |
5.90 |
5.51 - 6.20 |
0.583 times |
Fri 22 August 2025 |
5.83 (14.31%) |
5.18 |
5.18 - 6.05 |
0.7099 times |
Monthly price and charts CheetahMobile Strong monthly Stock price targets for CheetahMobile CMCM are 6.39 and 8.42 | Monthly Target 1 | 5.95 | | Monthly Target 2 | 6.82 | | Monthly Target 3 | 7.9833333333333 | | Monthly Target 4 | 8.85 | | Monthly Target 5 | 10.01 |
Monthly price and volumes Cheetah Mobile
| Date |
Closing |
Open |
Range |
Volume |
Mon 20 October 2025 |
7.68 (-4.71%) |
8.06 |
7.12 - 9.15 |
0.6159 times |
Tue 30 September 2025 |
8.06 (34.11%) |
5.79 |
5.79 - 9.44 |
2.3727 times |
Fri 29 August 2025 |
6.01 (13.4%) |
5.30 |
4.54 - 6.20 |
0.7859 times |
Thu 31 July 2025 |
5.30 (13.25%) |
4.68 |
4.52 - 6.62 |
1.3225 times |
Mon 30 June 2025 |
4.68 (2.41%) |
4.60 |
3.92 - 4.90 |
0.5946 times |
Fri 30 May 2025 |
4.57 (21.54%) |
3.80 |
3.65 - 4.66 |
0.5408 times |
Wed 30 April 2025 |
3.76 (-11.94%) |
4.39 |
3.28 - 4.56 |
0.63 times |
Mon 31 March 2025 |
4.27 (-19.28%) |
5.14 |
4.20 - 5.36 |
0.9361 times |
Fri 28 February 2025 |
5.29 (18.61%) |
4.25 |
4.25 - 6.60 |
1.4523 times |
Fri 31 January 2025 |
4.46 (-3.04%) |
4.70 |
3.95 - 5.07 |
0.7491 times |
Tue 31 December 2024 |
4.60 (-11.2%) |
5.79 |
4.50 - 6.77 |
1.214 times |
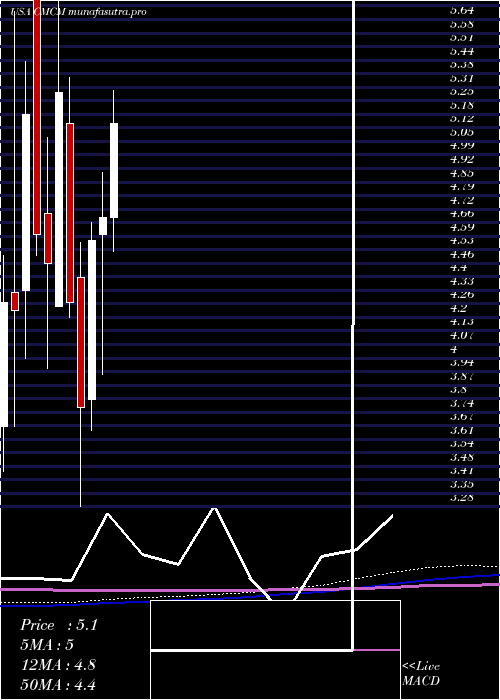
DMA SMA EMA moving averages of Cheetah Mobile CMCM
DMA (daily moving average) of Cheetah Mobile CMCM
| DMA period | DMA value | | 5 day DMA | 7.67 | | 12 day DMA | 8.04 | | 20 day DMA | 8.22 | | 35 day DMA | 7.71 | | 50 day DMA | 6.99 | | 100 day DMA | 5.88 | | 150 day DMA | 5.27 | | 200 day DMA | 5.19 | EMA (exponential moving average) of Cheetah Mobile CMCM
| EMA period | EMA current | EMA prev | EMA prev2 | | 5 day EMA | 7.69 | 7.7 | 7.85 | | 12 day EMA | 7.91 | 7.95 | 8.05 | | 20 day EMA | 7.9 | 7.92 | 7.98 | | 35 day EMA | 7.45 | 7.44 | 7.44 | | 50 day EMA | 6.9 | 6.87 | 6.85 |
SMA (simple moving average) of Cheetah Mobile CMCM
| SMA period | SMA current | SMA prev | SMA prev2 | | 5 day SMA | 7.67 | 7.7 | 7.94 | | 12 day SMA | 8.04 | 8.09 | 8.15 | | 20 day SMA | 8.22 | 8.27 | 8.33 | | 35 day SMA | 7.71 | 7.66 | 7.62 | | 50 day SMA | 6.99 | 6.93 | 6.88 | | 100 day SMA | 5.88 | 5.85 | 5.81 | | 150 day SMA | 5.27 | 5.25 | 5.24 | | 200 day SMA | 5.19 | 5.17 | 5.16 |
|
|
