CloroxCompany CLX full analysis,charts,indicators,moving averages,SMA,DMA,EMA,ADX,MACD,RSIClorox Company CLX WideScreen charts, DMA,SMA,EMA technical analysis, forecast prediction, by indicators ADX,MACD,RSI,CCI USA stock exchange
operates under Consumer Durables sector & deals in Specialty Chemicals
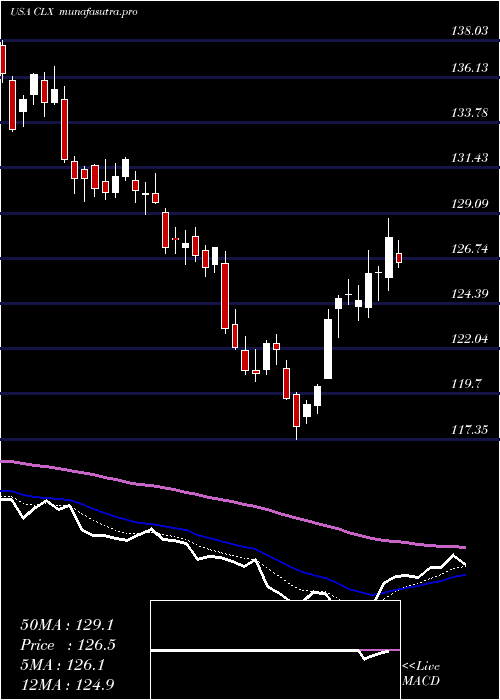
Daily price and charts and targets CloroxCompany Strong Daily Stock price targets for CloroxCompany CLX are 104.76 and 106.23 | Daily Target 1 | 103.73 | | Daily Target 2 | 104.32 | | Daily Target 3 | 105.20333333333 | | Daily Target 4 | 105.79 | | Daily Target 5 | 106.67 |
Daily price and volume Clorox Company
| Date |
Closing |
Open |
Range |
Volume |
Fri 05 December 2025 |
104.90 (-0.19%) |
104.71 |
104.62 - 106.09 |
0.6248 times |
Thu 04 December 2025 |
105.10 (-0.07%) |
106.20 |
104.82 - 107.00 |
0.6173 times |
Wed 03 December 2025 |
105.17 (-0.68%) |
106.18 |
105.04 - 107.23 |
0.7538 times |
Tue 02 December 2025 |
105.89 (-0.49%) |
106.00 |
105.00 - 107.85 |
0.9617 times |
Mon 01 December 2025 |
106.41 (-1.42%) |
107.56 |
106.24 - 107.99 |
0.8943 times |
Fri 28 November 2025 |
107.94 (0.18%) |
107.87 |
106.86 - 108.07 |
0.4346 times |
Wed 26 November 2025 |
107.75 (0.82%) |
106.38 |
106.38 - 108.18 |
0.737 times |
Tue 25 November 2025 |
106.87 (1.15%) |
106.77 |
106.00 - 107.52 |
1.2452 times |
Mon 24 November 2025 |
105.66 (1.67%) |
103.50 |
102.74 - 106.17 |
1.7749 times |
Fri 21 November 2025 |
103.92 (3.85%) |
100.53 |
100.53 - 105.61 |
1.9563 times |
Thu 20 November 2025 |
100.07 (1.67%) |
98.36 |
98.20 - 100.36 |
1.2708 times |
Weekly price and charts CloroxCompany Strong weekly Stock price targets for CloroxCompany CLX are 103.08 and 106.45 | Weekly Target 1 | 102.47 | | Weekly Target 2 | 103.68 | | Weekly Target 3 | 105.83666666667 | | Weekly Target 4 | 107.05 | | Weekly Target 5 | 109.21 |
Weekly price and volumes for Clorox Company
| Date |
Closing |
Open |
Range |
Volume |
Fri 05 December 2025 |
104.90 (-2.82%) |
107.56 |
104.62 - 107.99 |
1.0588 times |
Fri 28 November 2025 |
107.94 (3.87%) |
103.50 |
102.74 - 108.18 |
1.1522 times |
Fri 21 November 2025 |
103.92 (0.23%) |
103.40 |
98.20 - 105.61 |
1.7126 times |
Fri 14 November 2025 |
103.68 (-3.43%) |
107.02 |
103.43 - 107.32 |
0.9823 times |
Fri 07 November 2025 |
107.36 (-4.53%) |
111.00 |
106.14 - 113.71 |
1.1721 times |
Fri 31 October 2025 |
112.46 (0%) |
112.00 |
111.60 - 113.55 |
0.2768 times |
Fri 31 October 2025 |
112.46 (-2.93%) |
115.85 |
110.61 - 116.83 |
1.188 times |
Fri 24 October 2025 |
115.85 (-3.23%) |
119.70 |
115.83 - 121.12 |
0.7624 times |
Fri 17 October 2025 |
119.72 (-0.35%) |
119.96 |
117.22 - 121.79 |
0.7999 times |
Fri 10 October 2025 |
120.14 (-2.48%) |
123.20 |
117.53 - 123.69 |
0.895 times |
Fri 03 October 2025 |
123.19 (-0.96%) |
124.71 |
121.35 - 124.75 |
0.9157 times |
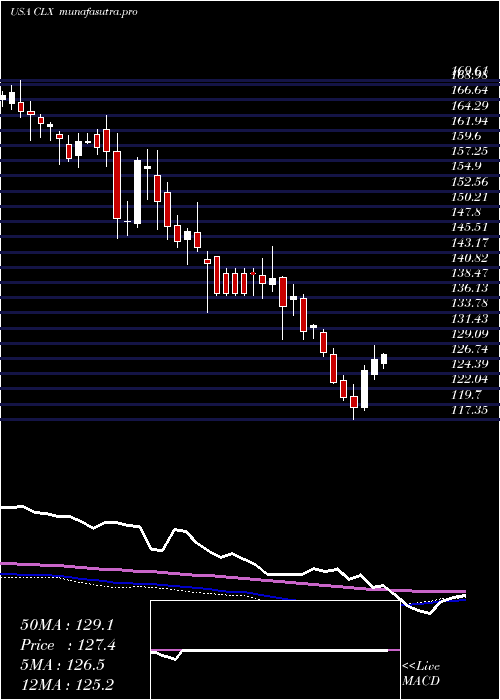
Monthly price and charts CloroxCompany Strong monthly Stock price targets for CloroxCompany CLX are 103.08 and 106.45 | Monthly Target 1 | 102.47 | | Monthly Target 2 | 103.68 | | Monthly Target 3 | 105.83666666667 | | Monthly Target 4 | 107.05 | | Monthly Target 5 | 109.21 |
Monthly price and volumes Clorox Company
| Date |
Closing |
Open |
Range |
Volume |
Fri 05 December 2025 |
104.90 (-2.82%) |
107.56 |
104.62 - 107.99 |
0.2521 times |
Fri 28 November 2025 |
107.94 (-4.02%) |
111.00 |
98.20 - 113.71 |
1.195 times |
Fri 31 October 2025 |
112.46 (-8.79%) |
122.93 |
110.61 - 124.14 |
1.0452 times |
Tue 30 September 2025 |
123.30 (4.31%) |
118.74 |
117.64 - 128.15 |
1.2642 times |
Fri 29 August 2025 |
118.20 (-5.86%) |
127.26 |
116.53 - 127.60 |
1.1245 times |
Thu 31 July 2025 |
125.56 (4.57%) |
120.51 |
120.51 - 132.03 |
1.1475 times |
Mon 30 June 2025 |
120.07 (-8.96%) |
130.78 |
117.35 - 131.26 |
1.0555 times |
Fri 30 May 2025 |
131.88 (-7.32%) |
140.93 |
129.68 - 141.50 |
1.1542 times |
Wed 30 April 2025 |
142.30 (-3.36%) |
148.08 |
133.82 - 150.84 |
0.8367 times |
Mon 31 March 2025 |
147.25 (-5.84%) |
155.00 |
141.23 - 158.91 |
0.9253 times |
Fri 28 February 2025 |
156.39 (-1.44%) |
158.69 |
145.19 - 161.45 |
0.9573 times |
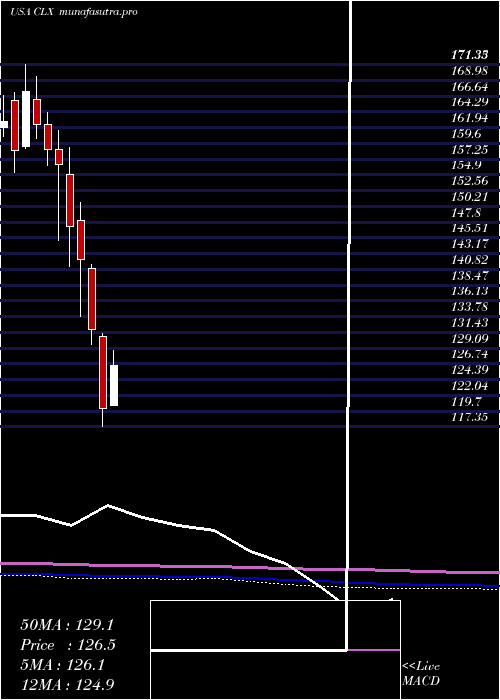
DMA SMA EMA moving averages of Clorox Company CLX
DMA (daily moving average) of Clorox Company CLX
| DMA period | DMA value | | 5 day DMA | 105.49 | | 12 day DMA | 104.84 | | 20 day DMA | 104.46 | | 35 day DMA | 108.66 | | 50 day DMA | 112.33 | | 100 day DMA | 118.01 | | 150 day DMA | 121.55 | | 200 day DMA | 127.38 | EMA (exponential moving average) of Clorox Company CLX
| EMA period | EMA current | EMA prev | EMA prev2 | | 5 day EMA | 105.37 | 105.6 | 105.85 | | 12 day EMA | 105.42 | 105.51 | 105.58 | | 20 day EMA | 106.18 | 106.32 | 106.45 | | 35 day EMA | 108.98 | 109.22 | 109.46 | | 50 day EMA | 112.4 | 112.71 | 113.02 |
SMA (simple moving average) of Clorox Company CLX
| SMA period | SMA current | SMA prev | SMA prev2 | | 5 day SMA | 105.49 | 106.1 | 106.63 | | 12 day SMA | 104.84 | 104.44 | 104.12 | | 20 day SMA | 104.46 | 104.53 | 104.72 | | 35 day SMA | 108.66 | 109.03 | 109.41 | | 50 day SMA | 112.33 | 112.69 | 113.05 | | 100 day SMA | 118.01 | 118.23 | 118.42 | | 150 day SMA | 121.55 | 121.77 | 122.02 | | 200 day SMA | 127.38 | 127.62 | 127.85 |
|
|
