CelesticaInc CLS full analysis,charts,indicators,moving averages,SMA,DMA,EMA,ADX,MACD,RSICelestica Inc CLS WideScreen charts, DMA,SMA,EMA technical analysis, forecast prediction, by indicators ADX,MACD,RSI,CCI USA stock exchange
operates under Technology sector & deals in Electrical Products
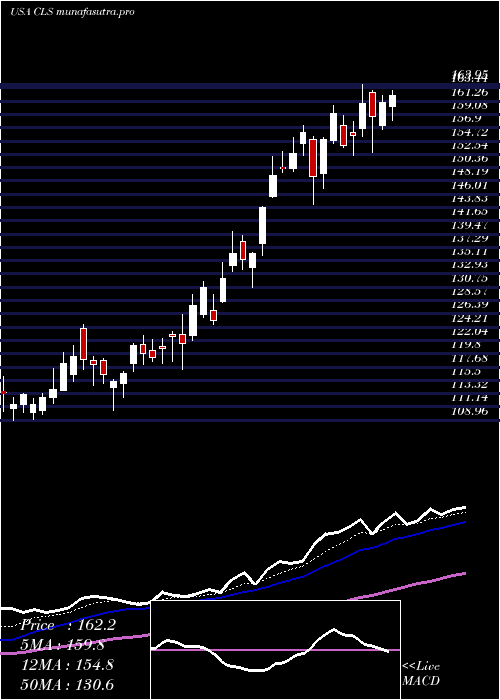
Daily price and charts and targets CelesticaInc Strong Daily Stock price targets for CelesticaInc CLS are 313.39 and 335.39 | Daily Target 1 | 295.59 | | Daily Target 2 | 309.19 | | Daily Target 3 | 317.59333333333 | | Daily Target 4 | 331.19 | | Daily Target 5 | 339.59 |
Daily price and volume Celestica Inc
| Date |
Closing |
Open |
Range |
Volume |
Thu 04 December 2025 |
322.78 (4.66%) |
307.07 |
304.00 - 326.00 |
0.4161 times |
Wed 03 December 2025 |
308.41 (1.35%) |
305.00 |
297.35 - 314.79 |
0.7237 times |
Tue 02 December 2025 |
304.29 (-4.42%) |
322.78 |
303.23 - 335.00 |
0.7873 times |
Mon 01 December 2025 |
318.37 (-7.56%) |
336.29 |
316.73 - 337.00 |
1.1216 times |
Fri 28 November 2025 |
344.41 (3.66%) |
333.13 |
331.00 - 344.78 |
0.5458 times |
Wed 26 November 2025 |
332.24 (1.3%) |
322.05 |
315.00 - 336.31 |
0.9244 times |
Tue 25 November 2025 |
327.98 (1.65%) |
321.00 |
316.50 - 333.89 |
0.749 times |
Mon 24 November 2025 |
322.65 (15.21%) |
285.24 |
282.00 - 324.02 |
1.198 times |
Fri 21 November 2025 |
280.06 (-0.79%) |
278.23 |
263.08 - 284.55 |
1.9041 times |
Thu 20 November 2025 |
282.28 (-9.66%) |
330.50 |
278.85 - 330.50 |
1.63 times |
Wed 19 November 2025 |
312.48 (4.26%) |
301.68 |
301.68 - 328.50 |
1.177 times |
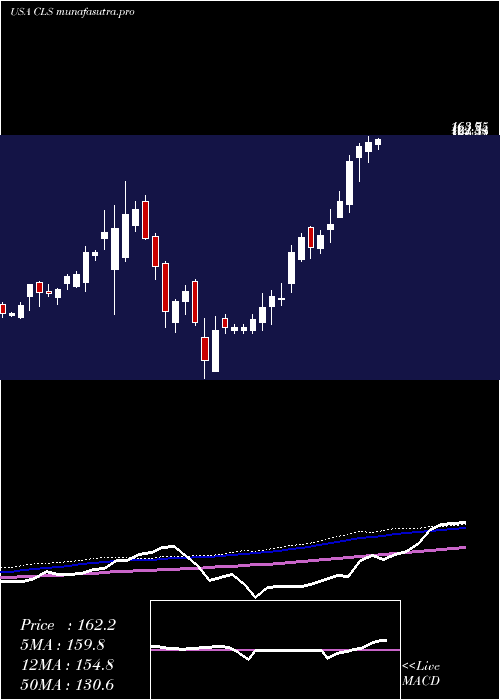
Weekly price and charts CelesticaInc Strong weekly Stock price targets for CelesticaInc CLS are 290.24 and 329.89 | Weekly Target 1 | 279.39 | | Weekly Target 2 | 301.09 | | Weekly Target 3 | 319.04333333333 | | Weekly Target 4 | 340.74 | | Weekly Target 5 | 358.69 |
Weekly price and volumes for Celestica Inc
| Date |
Closing |
Open |
Range |
Volume |
Thu 04 December 2025 |
322.78 (-6.28%) |
336.29 |
297.35 - 337.00 |
0.7242 times |
Fri 28 November 2025 |
344.41 (22.98%) |
285.24 |
282.00 - 344.78 |
0.8117 times |
Fri 21 November 2025 |
280.06 (-9.91%) |
306.90 |
263.08 - 330.50 |
1.5432 times |
Fri 14 November 2025 |
310.88 (-3.49%) |
340.68 |
275.77 - 346.20 |
1.1906 times |
Fri 07 November 2025 |
322.13 (-6.49%) |
338.00 |
303.50 - 363.40 |
0.7316 times |
Fri 31 October 2025 |
344.48 (0%) |
349.01 |
333.25 - 360.99 |
0.2375 times |
Fri 31 October 2025 |
344.48 (16.06%) |
306.69 |
301.69 - 360.99 |
1.922 times |
Fri 24 October 2025 |
296.81 (6.52%) |
284.11 |
261.48 - 300.75 |
0.6651 times |
Fri 17 October 2025 |
278.63 (14.32%) |
263.76 |
238.23 - 296.85 |
1.1986 times |
Fri 10 October 2025 |
243.72 (3.8%) |
235.30 |
230.24 - 263.90 |
0.9755 times |
Fri 03 October 2025 |
234.80 (-3.69%) |
246.89 |
231.44 - 258.44 |
0.7925 times |
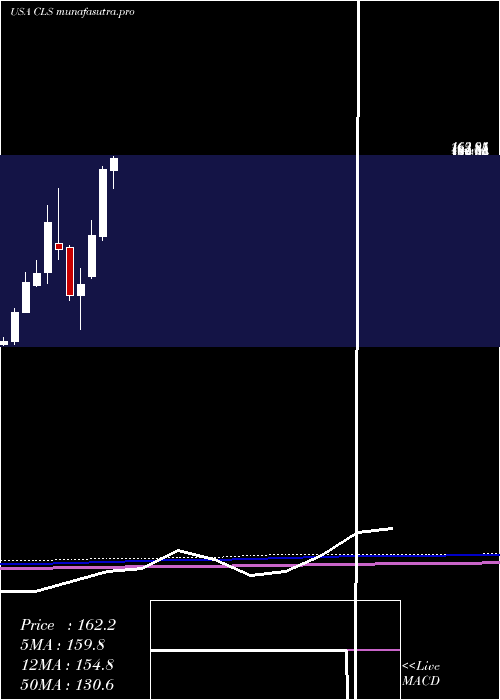
Monthly price and charts CelesticaInc Strong monthly Stock price targets for CelesticaInc CLS are 290.24 and 329.89 | Monthly Target 1 | 279.39 | | Monthly Target 2 | 301.09 | | Monthly Target 3 | 319.04333333333 | | Monthly Target 4 | 340.74 | | Monthly Target 5 | 358.69 |
Monthly price and volumes Celestica Inc
| Date |
Closing |
Open |
Range |
Volume |
Thu 04 December 2025 |
322.78 (-6.28%) |
336.29 |
297.35 - 337.00 |
0.1247 times |
Fri 28 November 2025 |
344.41 (-0.02%) |
338.00 |
263.08 - 363.40 |
0.7363 times |
Fri 31 October 2025 |
344.48 (39.82%) |
241.46 |
230.24 - 360.99 |
0.9414 times |
Tue 30 September 2025 |
246.38 (26.51%) |
187.80 |
183.66 - 261.83 |
1 times |
Fri 29 August 2025 |
194.75 (-2.56%) |
189.07 |
173.23 - 218.80 |
0.9279 times |
Thu 31 July 2025 |
199.86 (28.03%) |
154.90 |
144.27 - 214.47 |
1.3134 times |
Mon 30 June 2025 |
156.11 (35.3%) |
114.96 |
112.74 - 157.35 |
0.9407 times |
Fri 30 May 2025 |
115.38 (35.18%) |
90.24 |
89.02 - 124.67 |
1.1403 times |
Wed 30 April 2025 |
85.35 (8.3%) |
79.03 |
58.05 - 95.22 |
1.5488 times |
Mon 31 March 2025 |
78.81 (-26.38%) |
108.10 |
75.59 - 109.28 |
1.3266 times |
Fri 28 February 2025 |
107.05 (-13.3%) |
110.80 |
101.18 - 144.27 |
1.4158 times |
DMA SMA EMA moving averages of Celestica Inc CLS
DMA (daily moving average) of Celestica Inc CLS
| DMA period | DMA value | | 5 day DMA | 319.65 | | 12 day DMA | 312.97 | | 20 day DMA | 317.12 | | 35 day DMA | 313.42 | | 50 day DMA | 293.92 | | 100 day DMA | 250.35 | | 150 day DMA | 209.19 | | 200 day DMA | 179.19 | EMA (exponential moving average) of Celestica Inc CLS
| EMA period | EMA current | EMA prev | EMA prev2 | | 5 day EMA | 317.29 | 314.54 | 317.6 | | 12 day EMA | 316.69 | 315.58 | 316.88 | | 20 day EMA | 314.72 | 313.87 | 314.44 | | 35 day EMA | 303.08 | 301.92 | 301.54 | | 50 day EMA | 292.94 | 291.72 | 291.04 |
SMA (simple moving average) of Celestica Inc CLS
| SMA period | SMA current | SMA prev | SMA prev2 | | 5 day SMA | 319.65 | 321.54 | 325.46 | | 12 day SMA | 312.97 | 311.85 | 312.06 | | 20 day SMA | 317.12 | 318.62 | 319.99 | | 35 day SMA | 313.42 | 311.91 | 310.18 | | 50 day SMA | 293.92 | 292.27 | 291.26 | | 100 day SMA | 250.35 | 248.73 | 247.27 | | 150 day SMA | 209.19 | 207.61 | 206.14 | | 200 day SMA | 179.19 | 178.23 | 177.35 |
|
|
