ClipperRealty CLPR full analysis,charts,indicators,moving averages,SMA,DMA,EMA,ADX,MACD,RSIClipper Realty CLPR WideScreen charts, DMA,SMA,EMA technical analysis, forecast prediction, by indicators ADX,MACD,RSI,CCI USA stock exchange
operates under Consumer Services sector & deals in Real Estate Investment Trusts
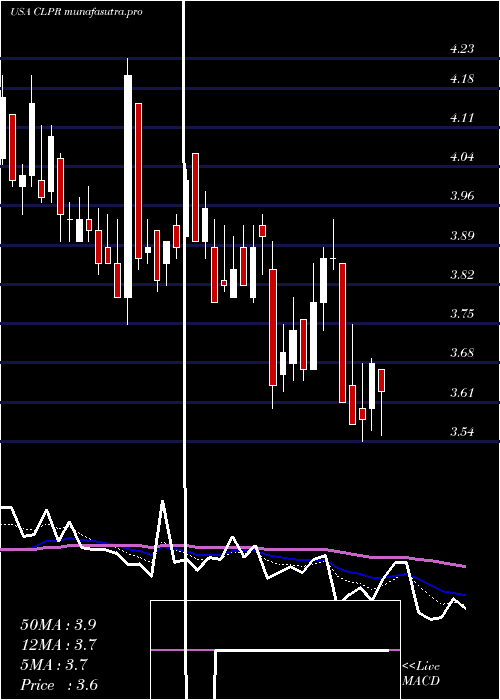
Daily price and charts and targets ClipperRealty Strong Daily Stock price targets for ClipperRealty CLPR are 4.09 and 4.43 | Daily Target 1 | 3.82 | | Daily Target 2 | 4.01 | | Daily Target 3 | 4.1633333333333 | | Daily Target 4 | 4.35 | | Daily Target 5 | 4.5 |
Daily price and volume Clipper Realty
| Date |
Closing |
Open |
Range |
Volume |
Mon 20 October 2025 |
4.19 (4.49%) |
4.00 |
3.98 - 4.32 |
1.0463 times |
Fri 17 October 2025 |
4.01 (-0.25%) |
3.96 |
3.96 - 4.06 |
0.3751 times |
Thu 16 October 2025 |
4.02 (-0.99%) |
4.07 |
3.98 - 4.08 |
0.479 times |
Wed 15 October 2025 |
4.06 (-2.17%) |
4.18 |
4.04 - 4.23 |
0.9223 times |
Tue 14 October 2025 |
4.15 (4.01%) |
3.96 |
3.93 - 4.19 |
1.0215 times |
Mon 13 October 2025 |
3.99 (5.56%) |
3.80 |
3.80 - 4.08 |
1.2339 times |
Fri 10 October 2025 |
3.78 (-2.83%) |
3.78 |
3.78 - 3.94 |
1.3951 times |
Thu 09 October 2025 |
3.89 (-1.02%) |
3.94 |
3.88 - 4.06 |
1.0138 times |
Wed 08 October 2025 |
3.93 (1.29%) |
3.88 |
3.88 - 4.07 |
1.6432 times |
Tue 07 October 2025 |
3.88 (-2.76%) |
4.01 |
3.83 - 4.04 |
0.8696 times |
Mon 06 October 2025 |
3.99 (-0.5%) |
4.02 |
3.94 - 4.14 |
1.1404 times |
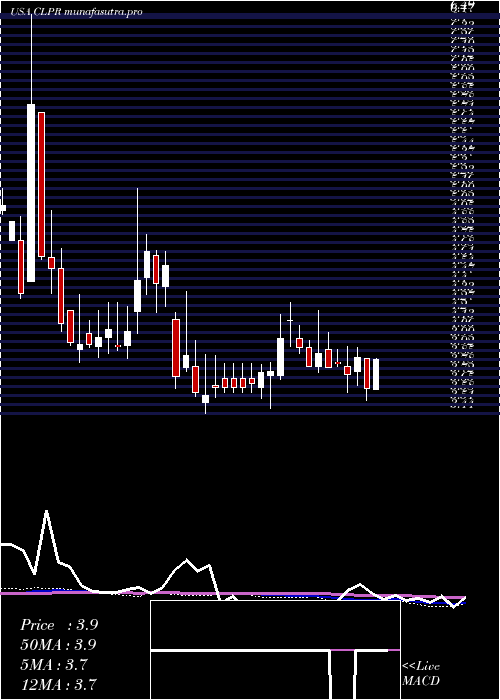
Weekly price and charts ClipperRealty Strong weekly Stock price targets for ClipperRealty CLPR are 4.09 and 4.43 | Weekly Target 1 | 3.82 | | Weekly Target 2 | 4.01 | | Weekly Target 3 | 4.1633333333333 | | Weekly Target 4 | 4.35 | | Weekly Target 5 | 4.5 |
Weekly price and volumes for Clipper Realty
| Date |
Closing |
Open |
Range |
Volume |
Mon 20 October 2025 |
4.19 (4.49%) |
4.00 |
3.98 - 4.32 |
0.2613 times |
Fri 17 October 2025 |
4.01 (6.08%) |
3.80 |
3.80 - 4.23 |
1.007 times |
Fri 10 October 2025 |
3.78 (-5.74%) |
4.02 |
3.78 - 4.14 |
1.514 times |
Fri 03 October 2025 |
4.01 (4.97%) |
3.84 |
3.60 - 4.16 |
1.3047 times |
Fri 26 September 2025 |
3.82 (-7.06%) |
4.11 |
3.78 - 4.18 |
0.8192 times |
Fri 19 September 2025 |
4.11 (-5.95%) |
4.29 |
4.11 - 4.37 |
1.3434 times |
Fri 12 September 2025 |
4.37 (-0.91%) |
4.47 |
4.27 - 4.52 |
1.0341 times |
Fri 05 September 2025 |
4.41 (-1.56%) |
4.49 |
4.19 - 4.50 |
0.76 times |
Fri 29 August 2025 |
4.48 (0%) |
4.45 |
4.35 - 4.52 |
0.2424 times |
Fri 29 August 2025 |
4.48 (6.67%) |
4.27 |
4.25 - 4.61 |
1.7139 times |
Fri 22 August 2025 |
4.20 (9.95%) |
3.78 |
3.55 - 4.33 |
2.4267 times |
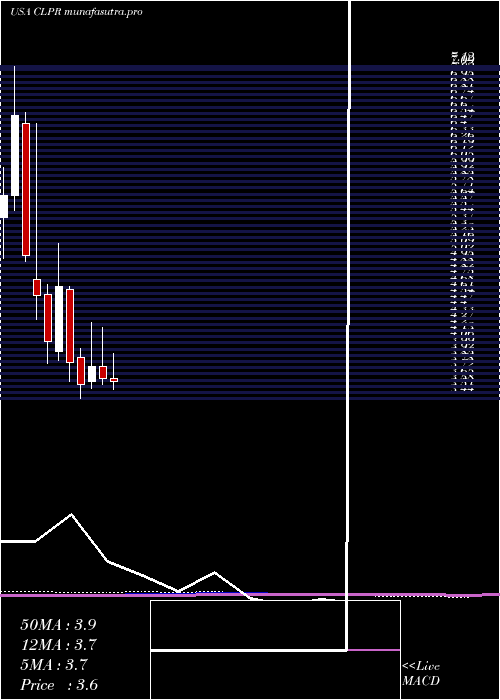
Monthly price and charts ClipperRealty Strong monthly Stock price targets for ClipperRealty CLPR are 3.9 and 4.62 | Monthly Target 1 | 3.32 | | Monthly Target 2 | 3.75 | | Monthly Target 3 | 4.0366666666667 | | Monthly Target 4 | 4.47 | | Monthly Target 5 | 4.76 |
Monthly price and volumes Clipper Realty
| Date |
Closing |
Open |
Range |
Volume |
Mon 20 October 2025 |
4.19 (10.26%) |
3.80 |
3.60 - 4.32 |
0.4895 times |
Tue 30 September 2025 |
3.80 (-15.18%) |
4.49 |
3.78 - 4.52 |
0.5339 times |
Fri 29 August 2025 |
4.48 (28.74%) |
3.47 |
3.39 - 4.61 |
1.0293 times |
Thu 31 July 2025 |
3.48 (-5.18%) |
3.67 |
3.47 - 4.38 |
0.9716 times |
Mon 30 June 2025 |
3.67 (-3.42%) |
3.80 |
3.60 - 4.23 |
1.0484 times |
Fri 30 May 2025 |
3.80 (5.56%) |
3.63 |
3.55 - 4.29 |
0.7758 times |
Wed 30 April 2025 |
3.60 (-6.25%) |
3.90 |
3.44 - 4.00 |
1.1018 times |
Mon 31 March 2025 |
3.84 (-17.95%) |
4.65 |
3.63 - 4.69 |
2.2134 times |
Fri 28 February 2025 |
4.68 (14.71%) |
3.96 |
3.86 - 5.16 |
0.7697 times |
Fri 31 January 2025 |
4.08 (-10.92%) |
4.60 |
3.83 - 4.71 |
1.0667 times |
Tue 31 December 2024 |
4.58 (-8.95%) |
4.76 |
4.32 - 6.49 |
2.505 times |
DMA SMA EMA moving averages of Clipper Realty CLPR
DMA (daily moving average) of Clipper Realty CLPR
| DMA period | DMA value | | 5 day DMA | 4.09 | | 12 day DMA | 3.99 | | 20 day DMA | 3.94 | | 35 day DMA | 4.09 | | 50 day DMA | 4.12 | | 100 day DMA | 3.96 | | 150 day DMA | 3.91 | | 200 day DMA | 3.99 | EMA (exponential moving average) of Clipper Realty CLPR
| EMA period | EMA current | EMA prev | EMA prev2 | | 5 day EMA | 4.07 | 4.01 | 4.01 | | 12 day EMA | 4.02 | 3.99 | 3.99 | | 20 day EMA | 4.01 | 3.99 | 3.99 | | 35 day EMA | 4.03 | 4.02 | 4.02 | | 50 day EMA | 4.08 | 4.08 | 4.08 |
SMA (simple moving average) of Clipper Realty CLPR
| SMA period | SMA current | SMA prev | SMA prev2 | | 5 day SMA | 4.09 | 4.05 | 4 | | 12 day SMA | 3.99 | 3.96 | 3.95 | | 20 day SMA | 3.94 | 3.94 | 3.94 | | 35 day SMA | 4.09 | 4.1 | 4.11 | | 50 day SMA | 4.12 | 4.11 | 4.11 | | 100 day SMA | 3.96 | 3.96 | 3.95 | | 150 day SMA | 3.91 | 3.91 | 3.91 | | 200 day SMA | 3.99 | 3.99 | 3.99 |
|
|
