ClearsignCombustion CLIR full analysis,charts,indicators,moving averages,SMA,DMA,EMA,ADX,MACD,RSIClearsign Combustion CLIR WideScreen charts, DMA,SMA,EMA technical analysis, forecast prediction, by indicators ADX,MACD,RSI,CCI USA stock exchange
operates under Capital Goods sector & deals in Industrial Machinery Components
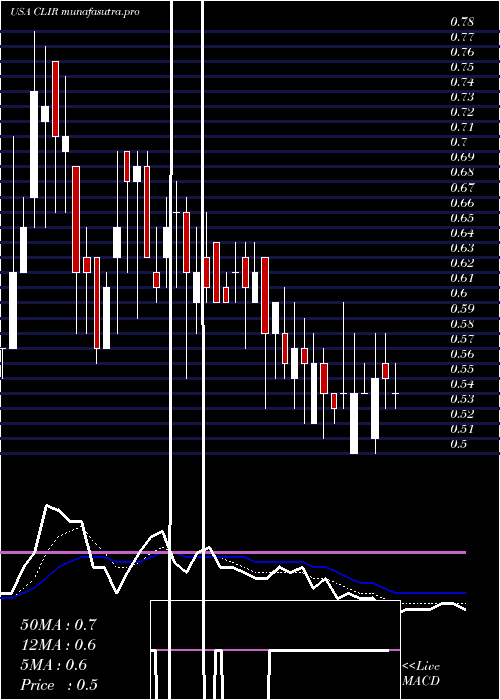
Daily price and charts and targets ClearsignCombustion Strong Daily Stock price targets for ClearsignCombustion CLIR are 0.89 and 1.07 | Daily Target 1 | 0.74 | | Daily Target 2 | 0.86 | | Daily Target 3 | 0.92 | | Daily Target 4 | 1.04 | | Daily Target 5 | 1.1 |
Daily price and volume Clearsign Combustion
| Date |
Closing |
Open |
Range |
Volume |
Mon 20 October 2025 |
0.98 (15.29%) |
0.82 |
0.80 - 0.98 |
0.4164 times |
Fri 17 October 2025 |
0.85 (-2.3%) |
0.81 |
0.81 - 0.90 |
0.6621 times |
Thu 16 October 2025 |
0.87 (-10.31%) |
1.02 |
0.85 - 1.02 |
0.6842 times |
Wed 15 October 2025 |
0.97 (-3.96%) |
0.91 |
0.91 - 1.00 |
0.8054 times |
Tue 14 October 2025 |
1.01 (9.78%) |
0.86 |
0.83 - 1.01 |
0.646 times |
Mon 13 October 2025 |
0.92 (6.98%) |
0.88 |
0.81 - 0.93 |
0.6989 times |
Fri 10 October 2025 |
0.86 (-6.52%) |
0.92 |
0.81 - 0.92 |
0.852 times |
Thu 09 October 2025 |
0.92 (-6.12%) |
1.00 |
0.91 - 1.00 |
0.6785 times |
Wed 08 October 2025 |
0.98 (2.08%) |
0.93 |
0.88 - 0.99 |
0.5727 times |
Tue 07 October 2025 |
0.96 (-11.11%) |
1.09 |
0.86 - 1.11 |
3.9837 times |
Mon 06 October 2025 |
1.08 (25.58%) |
0.89 |
0.88 - 1.12 |
4.4142 times |
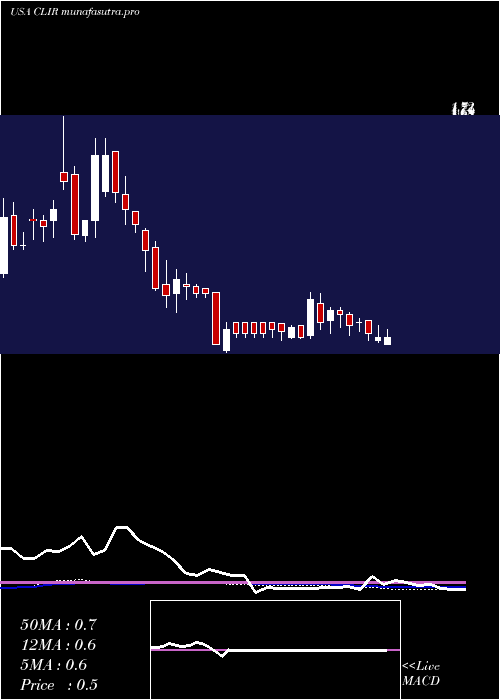
Weekly price and charts ClearsignCombustion Strong weekly Stock price targets for ClearsignCombustion CLIR are 0.89 and 1.07 | Weekly Target 1 | 0.74 | | Weekly Target 2 | 0.86 | | Weekly Target 3 | 0.92 | | Weekly Target 4 | 1.04 | | Weekly Target 5 | 1.1 |
Weekly price and volumes for Clearsign Combustion
| Date |
Closing |
Open |
Range |
Volume |
Mon 20 October 2025 |
0.98 (15.29%) |
0.82 |
0.80 - 0.98 |
0.026 times |
Fri 17 October 2025 |
0.85 (-1.16%) |
0.88 |
0.81 - 1.02 |
0.2179 times |
Fri 10 October 2025 |
0.86 (0%) |
0.89 |
0.81 - 1.12 |
0.6545 times |
Fri 03 October 2025 |
0.86 (6.17%) |
0.86 |
0.75 - 0.88 |
0.1916 times |
Fri 26 September 2025 |
0.81 (19.12%) |
0.66 |
0.61 - 0.90 |
0.9252 times |
Fri 19 September 2025 |
0.68 (25.93%) |
0.56 |
0.46 - 0.95 |
7.816 times |
Fri 12 September 2025 |
0.54 (-8.47%) |
0.60 |
0.54 - 0.60 |
0.0745 times |
Fri 05 September 2025 |
0.59 (1.72%) |
0.61 |
0.58 - 0.61 |
0.036 times |
Fri 29 August 2025 |
0.58 (0%) |
0.59 |
0.58 - 0.60 |
0.0035 times |
Fri 29 August 2025 |
0.58 (-1.69%) |
0.61 |
0.57 - 0.61 |
0.0548 times |
Fri 22 August 2025 |
0.59 (5.36%) |
0.57 |
0.52 - 0.62 |
0.063 times |
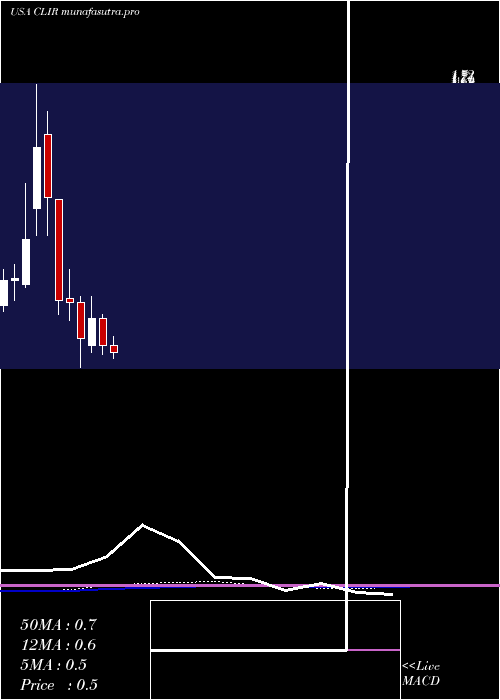
Monthly price and charts ClearsignCombustion Strong monthly Stock price targets for ClearsignCombustion CLIR are 0.88 and 1.23 | Monthly Target 1 | 0.61 | | Monthly Target 2 | 0.79 | | Monthly Target 3 | 0.95666666666667 | | Monthly Target 4 | 1.14 | | Monthly Target 5 | 1.31 |
Monthly price and volumes Clearsign Combustion
| Date |
Closing |
Open |
Range |
Volume |
Mon 20 October 2025 |
0.98 (27.27%) |
0.77 |
0.77 - 1.12 |
0.7833 times |
Tue 30 September 2025 |
0.77 (32.76%) |
0.61 |
0.46 - 0.95 |
6.9703 times |
Fri 29 August 2025 |
0.58 (0%) |
0.57 |
0.50 - 0.62 |
0.2101 times |
Thu 31 July 2025 |
0.58 (3.57%) |
0.56 |
0.49 - 0.65 |
0.3009 times |
Mon 30 June 2025 |
0.56 (-17.65%) |
0.68 |
0.52 - 0.70 |
0.1451 times |
Fri 30 May 2025 |
0.68 (15.25%) |
0.56 |
0.53 - 0.78 |
0.2185 times |
Wed 30 April 2025 |
0.59 (-21.33%) |
0.75 |
0.46 - 0.78 |
0.3333 times |
Mon 31 March 2025 |
0.75 (-1.32%) |
0.77 |
0.67 - 0.90 |
0.1937 times |
Fri 28 February 2025 |
0.76 (-37.7%) |
1.21 |
0.70 - 1.21 |
0.326 times |
Fri 31 January 2025 |
1.22 (-15.28%) |
1.50 |
1.05 - 1.60 |
0.5189 times |
Tue 31 December 2024 |
1.44 (39.81%) |
1.17 |
1.05 - 1.72 |
0.4093 times |
DMA SMA EMA moving averages of Clearsign Combustion CLIR
DMA (daily moving average) of Clearsign Combustion CLIR
| DMA period | DMA value | | 5 day DMA | 0.94 | | 12 day DMA | 0.94 | | 20 day DMA | 0.87 | | 35 day DMA | 0.75 | | 50 day DMA | 0.7 | | 100 day DMA | 0.64 | | 150 day DMA | 0.63 | | 200 day DMA | 0.74 | EMA (exponential moving average) of Clearsign Combustion CLIR
| EMA period | EMA current | EMA prev | EMA prev2 | | 5 day EMA | 0.93 | 0.9 | 0.92 | | 12 day EMA | 0.9 | 0.88 | 0.89 | | 20 day EMA | 0.86 | 0.85 | 0.85 | | 35 day EMA | 0.8 | 0.79 | 0.79 | | 50 day EMA | 0.71 | 0.7 | 0.69 |
SMA (simple moving average) of Clearsign Combustion CLIR
| SMA period | SMA current | SMA prev | SMA prev2 | | 5 day SMA | 0.94 | 0.92 | 0.93 | | 12 day SMA | 0.94 | 0.93 | 0.92 | | 20 day SMA | 0.87 | 0.87 | 0.86 | | 35 day SMA | 0.75 | 0.74 | 0.73 | | 50 day SMA | 0.7 | 0.69 | 0.68 | | 100 day SMA | 0.64 | 0.64 | 0.63 | | 150 day SMA | 0.63 | 0.63 | 0.63 | | 200 day SMA | 0.74 | 0.74 | 0.74 |
|
|
