ClevelandCliffs CLF full analysis,charts,indicators,moving averages,SMA,DMA,EMA,ADX,MACD,RSICleveland Cliffs CLF WideScreen charts, DMA,SMA,EMA technical analysis, forecast prediction, by indicators ADX,MACD,RSI,CCI USA stock exchange
operates under Basic Industries sector & deals in Precious Metals
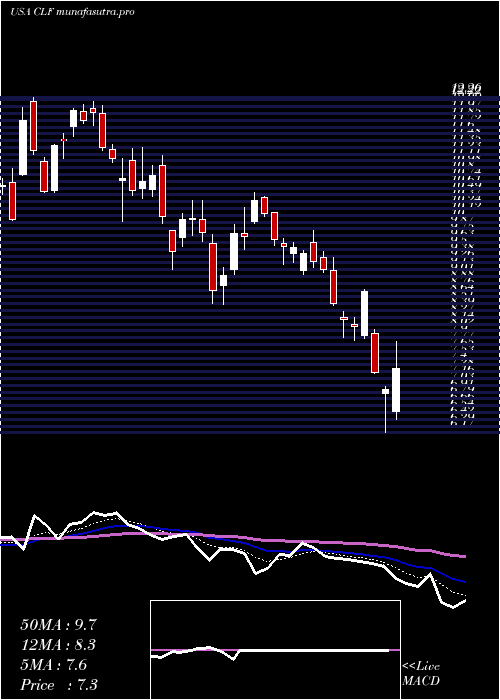
Daily price and charts and targets ClevelandCliffs Strong Daily Stock price targets for ClevelandCliffs CLF are 14.1 and 18.74 | Daily Target 1 | 10.33 | | Daily Target 2 | 13.23 | | Daily Target 3 | 14.966666666667 | | Daily Target 4 | 17.87 | | Daily Target 5 | 19.61 |
Daily price and volume Cleveland Cliffs
| Date |
Closing |
Open |
Range |
Volume |
Mon 20 October 2025 |
16.14 (21.17%) |
13.32 |
12.06 - 16.70 |
1.5697 times |
Fri 17 October 2025 |
13.32 (-1.77%) |
13.28 |
13.11 - 13.49 |
0.5966 times |
Thu 16 October 2025 |
13.56 (-2.8%) |
14.02 |
13.43 - 14.14 |
1.4638 times |
Wed 15 October 2025 |
13.95 (-0.07%) |
14.06 |
13.66 - 14.27 |
0.8003 times |
Tue 14 October 2025 |
13.96 (0.94%) |
13.39 |
13.13 - 14.22 |
1.4804 times |
Mon 13 October 2025 |
13.83 (7.96%) |
13.70 |
13.30 - 13.98 |
1.6324 times |
Tue 07 October 2025 |
12.81 (1.59%) |
12.76 |
12.66 - 13.19 |
1.0668 times |
Mon 06 October 2025 |
12.61 (-0.94%) |
12.80 |
12.55 - 13.01 |
0.401 times |
Fri 03 October 2025 |
12.73 (0.32%) |
12.75 |
12.62 - 13.08 |
0.4223 times |
Thu 02 October 2025 |
12.69 (2.01%) |
12.54 |
12.48 - 12.97 |
0.5667 times |
Wed 01 October 2025 |
12.44 (1.97%) |
12.22 |
12.08 - 12.56 |
0.7818 times |
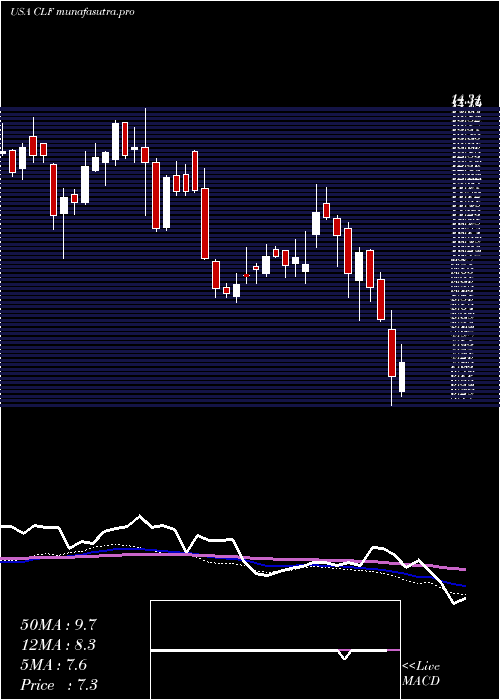
Weekly price and charts ClevelandCliffs Strong weekly Stock price targets for ClevelandCliffs CLF are 14.1 and 18.74 | Weekly Target 1 | 10.33 | | Weekly Target 2 | 13.23 | | Weekly Target 3 | 14.966666666667 | | Weekly Target 4 | 17.87 | | Weekly Target 5 | 19.61 |
Weekly price and volumes for Cleveland Cliffs
| Date |
Closing |
Open |
Range |
Volume |
Mon 20 October 2025 |
16.14 (21.17%) |
13.32 |
12.06 - 16.70 |
0.6748 times |
Fri 17 October 2025 |
13.32 (3.98%) |
13.70 |
13.11 - 14.27 |
2.5682 times |
Tue 07 October 2025 |
12.81 (0.63%) |
12.80 |
12.55 - 13.19 |
0.631 times |
Fri 03 October 2025 |
12.73 (2.91%) |
12.46 |
12.02 - 13.08 |
1.3194 times |
Fri 26 September 2025 |
12.37 (6.55%) |
11.58 |
11.27 - 12.38 |
1.2499 times |
Fri 19 September 2025 |
11.61 (-0.6%) |
11.94 |
10.95 - 12.25 |
1.0957 times |
Fri 12 September 2025 |
11.68 (2.55%) |
11.39 |
10.63 - 11.91 |
0.9286 times |
Fri 05 September 2025 |
11.39 (5.95%) |
10.50 |
10.06 - 11.40 |
0.6415 times |
Fri 29 August 2025 |
10.75 (0%) |
10.77 |
10.65 - 11.00 |
0.1364 times |
Fri 29 August 2025 |
10.75 (2.97%) |
10.45 |
10.36 - 11.10 |
0.7545 times |
Fri 22 August 2025 |
10.44 (0.29%) |
10.39 |
9.86 - 10.72 |
0.7903 times |
Monthly price and charts ClevelandCliffs Strong monthly Stock price targets for ClevelandCliffs CLF are 14.1 and 18.74 | Monthly Target 1 | 10.33 | | Monthly Target 2 | 13.23 | | Monthly Target 3 | 14.966666666667 | | Monthly Target 4 | 17.87 | | Monthly Target 5 | 19.61 |
Monthly price and volumes Cleveland Cliffs
| Date |
Closing |
Open |
Range |
Volume |
Mon 20 October 2025 |
16.14 (32.3%) |
12.22 |
12.06 - 16.70 |
0.955 times |
Tue 30 September 2025 |
12.20 (13.49%) |
10.50 |
10.06 - 13.05 |
0.9217 times |
Fri 29 August 2025 |
10.75 (2.19%) |
10.29 |
9.30 - 11.10 |
0.7048 times |
Thu 31 July 2025 |
10.52 (38.42%) |
7.62 |
7.42 - 11.96 |
1.3749 times |
Mon 30 June 2025 |
7.60 (30.36%) |
7.19 |
6.71 - 8.09 |
1.7052 times |
Fri 30 May 2025 |
5.83 (-29.25%) |
8.30 |
5.63 - 9.19 |
1.208 times |
Wed 30 April 2025 |
8.24 (0.24%) |
8.14 |
6.17 - 8.77 |
0.8467 times |
Mon 31 March 2025 |
8.22 (-24.17%) |
11.03 |
7.91 - 11.21 |
0.9009 times |
Fri 28 February 2025 |
10.84 (5.86%) |
9.85 |
9.53 - 12.26 |
0.8151 times |
Fri 31 January 2025 |
10.24 (8.94%) |
9.52 |
9.11 - 10.75 |
0.5676 times |
Tue 31 December 2024 |
9.40 (-21.99%) |
13.18 |
8.99 - 13.19 |
0.5719 times |

DMA SMA EMA moving averages of Cleveland Cliffs CLF
DMA (daily moving average) of Cleveland Cliffs CLF
| DMA period | DMA value | | 5 day DMA | 14.19 | | 12 day DMA | 13.35 | | 20 day DMA | 12.78 | | 35 day DMA | 12.07 | | 50 day DMA | 11.52 | | 100 day DMA | 10 | | 150 day DMA | 9.35 | | 200 day DMA | 9.6 | EMA (exponential moving average) of Cleveland Cliffs CLF
| EMA period | EMA current | EMA prev | EMA prev2 | | 5 day EMA | 14.36 | 13.47 | 13.55 | | 12 day EMA | 13.57 | 13.1 | 13.06 | | 20 day EMA | 13.03 | 12.7 | 12.64 | | 35 day EMA | 12.3 | 12.07 | 12 | | 50 day EMA | 11.67 | 11.49 | 11.42 |
SMA (simple moving average) of Cleveland Cliffs CLF
| SMA period | SMA current | SMA prev | SMA prev2 | | 5 day SMA | 14.19 | 13.72 | 13.62 | | 12 day SMA | 13.35 | 13.08 | 13 | | 20 day SMA | 12.78 | 12.53 | 12.45 | | 35 day SMA | 12.07 | 11.91 | 11.83 | | 50 day SMA | 11.52 | 11.39 | 11.31 | | 100 day SMA | 10 | 9.9 | 9.85 | | 150 day SMA | 9.35 | 9.31 | 9.28 | | 200 day SMA | 9.6 | 9.56 | 9.54 |
|
|
