CelldexTherapeutics CLDX full analysis,charts,indicators,moving averages,SMA,DMA,EMA,ADX,MACD,RSICelldex Therapeutics CLDX WideScreen charts, DMA,SMA,EMA technical analysis, forecast prediction, by indicators ADX,MACD,RSI,CCI USA stock exchange
operates under Health Care sector & deals in Biotechnology In Vitro In Vivo Diagnostic Substances
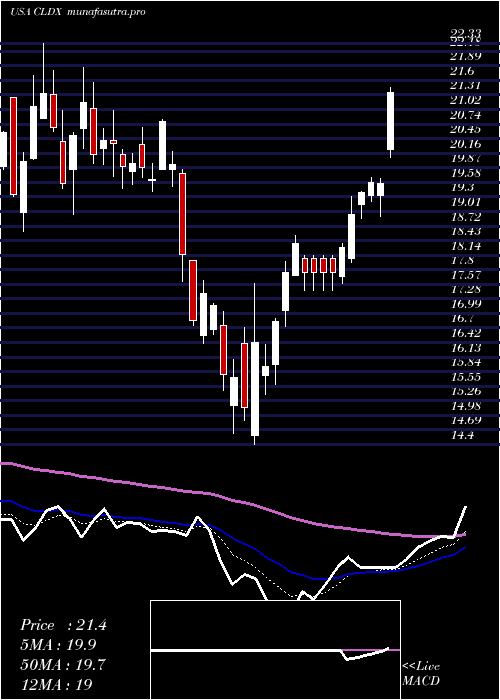
Daily price and charts and targets CelldexTherapeutics Strong Daily Stock price targets for CelldexTherapeutics CLDX are 27.14 and 28.34 | Daily Target 1 | 26.16 | | Daily Target 2 | 26.91 | | Daily Target 3 | 27.356666666667 | | Daily Target 4 | 28.11 | | Daily Target 5 | 28.56 |
Daily price and volume Celldex Therapeutics
| Date |
Closing |
Open |
Range |
Volume |
Mon 20 October 2025 |
27.67 (3.13%) |
27.58 |
26.60 - 27.80 |
0.7146 times |
Fri 17 October 2025 |
26.83 (1.05%) |
26.35 |
26.03 - 27.01 |
0.7952 times |
Thu 16 October 2025 |
26.55 (-2.89%) |
27.53 |
26.17 - 27.89 |
0.8732 times |
Wed 15 October 2025 |
27.34 (3.29%) |
26.21 |
26.10 - 27.73 |
1.1047 times |
Tue 14 October 2025 |
26.47 (-2.43%) |
26.81 |
26.45 - 27.44 |
1.088 times |
Mon 13 October 2025 |
27.13 (1.34%) |
24.87 |
24.50 - 27.40 |
1.2425 times |
Fri 10 October 2025 |
26.77 (-2.8%) |
27.62 |
26.31 - 27.74 |
1.3639 times |
Thu 09 October 2025 |
27.54 (1.1%) |
27.20 |
26.96 - 27.98 |
0.8877 times |
Wed 08 October 2025 |
27.24 (3.89%) |
26.40 |
26.17 - 27.83 |
1.204 times |
Tue 07 October 2025 |
26.22 (-0.61%) |
26.45 |
25.81 - 26.45 |
0.7262 times |
Mon 06 October 2025 |
26.38 (-0.11%) |
26.50 |
26.05 - 26.90 |
1.0466 times |
Weekly price and charts CelldexTherapeutics Strong weekly Stock price targets for CelldexTherapeutics CLDX are 27.14 and 28.34 | Weekly Target 1 | 26.16 | | Weekly Target 2 | 26.91 | | Weekly Target 3 | 27.356666666667 | | Weekly Target 4 | 28.11 | | Weekly Target 5 | 28.56 |
Weekly price and volumes for Celldex Therapeutics
| Date |
Closing |
Open |
Range |
Volume |
Mon 20 October 2025 |
27.67 (3.13%) |
27.58 |
26.60 - 27.80 |
0.1287 times |
Fri 17 October 2025 |
26.83 (0.22%) |
24.87 |
24.50 - 27.89 |
0.919 times |
Fri 10 October 2025 |
26.77 (1.36%) |
26.50 |
25.81 - 27.98 |
0.9415 times |
Fri 03 October 2025 |
26.41 (1.03%) |
26.14 |
24.49 - 26.51 |
0.9485 times |
Fri 26 September 2025 |
26.14 (6.22%) |
24.65 |
24.03 - 26.37 |
1.0383 times |
Fri 19 September 2025 |
24.61 (0.65%) |
24.58 |
24.02 - 26.33 |
1.4524 times |
Fri 12 September 2025 |
24.45 (6.91%) |
22.85 |
22.43 - 25.51 |
1.5591 times |
Fri 05 September 2025 |
22.87 (3.58%) |
21.88 |
21.77 - 23.69 |
1.239 times |
Fri 29 August 2025 |
22.08 (0%) |
22.52 |
21.71 - 23.02 |
0.2702 times |
Fri 29 August 2025 |
22.08 (-1.69%) |
22.74 |
21.33 - 23.27 |
1.5034 times |
Fri 22 August 2025 |
22.46 (-11.92%) |
25.15 |
20.37 - 25.54 |
2.104 times |
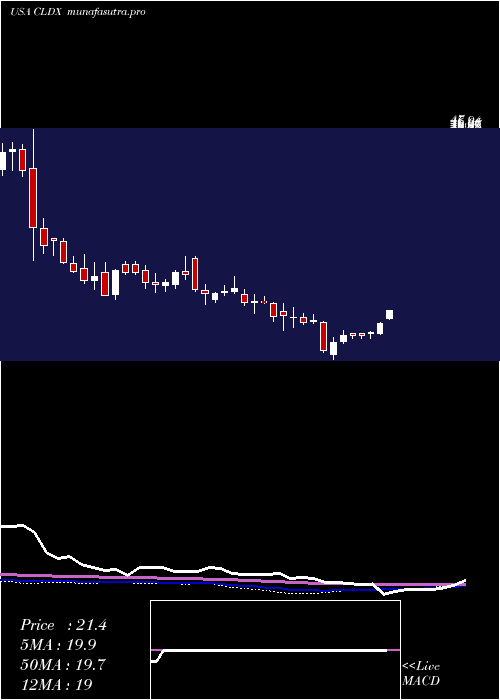
Monthly price and charts CelldexTherapeutics Strong monthly Stock price targets for CelldexTherapeutics CLDX are 26.08 and 29.57 | Monthly Target 1 | 23.22 | | Monthly Target 2 | 25.45 | | Monthly Target 3 | 26.713333333333 | | Monthly Target 4 | 28.94 | | Monthly Target 5 | 30.2 |
Monthly price and volumes Celldex Therapeutics
| Date |
Closing |
Open |
Range |
Volume |
Mon 20 October 2025 |
27.67 (6.96%) |
25.88 |
24.49 - 27.98 |
0.6127 times |
Tue 30 September 2025 |
25.87 (17.16%) |
21.88 |
21.77 - 26.46 |
1.3641 times |
Fri 29 August 2025 |
22.08 (0.45%) |
21.81 |
19.72 - 25.79 |
1.53 times |
Thu 31 July 2025 |
21.98 (8.01%) |
20.31 |
20.01 - 24.06 |
1.011 times |
Mon 30 June 2025 |
20.35 (2.88%) |
19.79 |
19.25 - 24.03 |
1.1118 times |
Fri 30 May 2025 |
19.78 (-5.04%) |
20.61 |
17.85 - 21.23 |
0.9399 times |
Wed 30 April 2025 |
20.83 (14.77%) |
18.03 |
14.40 - 21.58 |
0.8278 times |
Mon 31 March 2025 |
18.15 (-11.76%) |
21.27 |
17.63 - 22.33 |
0.7162 times |
Fri 28 February 2025 |
20.57 (-16.01%) |
23.69 |
19.83 - 24.38 |
0.709 times |
Fri 31 January 2025 |
24.49 (-3.09%) |
25.54 |
22.17 - 29.05 |
1.1776 times |
Tue 31 December 2024 |
25.27 (-5.57%) |
27.11 |
23.94 - 27.74 |
0.6914 times |

DMA SMA EMA moving averages of Celldex Therapeutics CLDX
DMA (daily moving average) of Celldex Therapeutics CLDX
| DMA period | DMA value | | 5 day DMA | 26.97 | | 12 day DMA | 26.88 | | 20 day DMA | 26.35 | | 35 day DMA | 25.42 | | 50 day DMA | 24.71 | | 100 day DMA | 23.06 | | 150 day DMA | 21.71 | | 200 day DMA | 22.04 | EMA (exponential moving average) of Celldex Therapeutics CLDX
| EMA period | EMA current | EMA prev | EMA prev2 | | 5 day EMA | 27.1 | 26.82 | 26.82 | | 12 day EMA | 26.77 | 26.61 | 26.57 | | 20 day EMA | 26.34 | 26.2 | 26.13 | | 35 day EMA | 25.51 | 25.38 | 25.29 | | 50 day EMA | 24.63 | 24.51 | 24.42 |
SMA (simple moving average) of Celldex Therapeutics CLDX
| SMA period | SMA current | SMA prev | SMA prev2 | | 5 day SMA | 26.97 | 26.86 | 26.85 | | 12 day SMA | 26.88 | 26.73 | 26.6 | | 20 day SMA | 26.35 | 26.21 | 26.1 | | 35 day SMA | 25.42 | 25.26 | 25.12 | | 50 day SMA | 24.71 | 24.56 | 24.43 | | 100 day SMA | 23.06 | 22.98 | 22.92 | | 150 day SMA | 21.71 | 21.66 | 21.62 | | 200 day SMA | 22.04 | 22.03 | 22.02 |
|
|
