ChathamLodging CLDT full analysis,charts,indicators,moving averages,SMA,DMA,EMA,ADX,MACD,RSIChatham Lodging CLDT WideScreen charts, DMA,SMA,EMA technical analysis, forecast prediction, by indicators ADX,MACD,RSI,CCI USA stock exchange
operates under Consumer Services sector & deals in Real Estate Investment Trusts
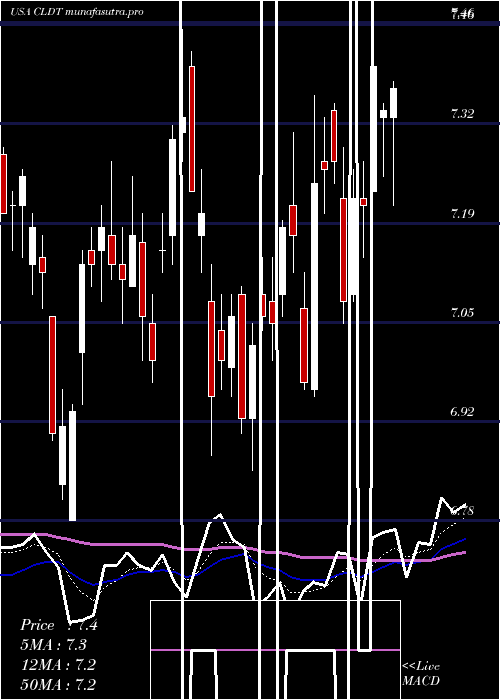
Daily price and charts and targets ChathamLodging Strong Daily Stock price targets for ChathamLodging CLDT are 6.44 and 6.57 | Daily Target 1 | 6.34 | | Daily Target 2 | 6.4 | | Daily Target 3 | 6.4666666666667 | | Daily Target 4 | 6.53 | | Daily Target 5 | 6.6 |
Daily price and volume Chatham Lodging
| Date |
Closing |
Open |
Range |
Volume |
Tue 21 October 2025 |
6.47 (0.78%) |
6.40 |
6.40 - 6.53 |
1.2005 times |
Mon 20 October 2025 |
6.42 (1.74%) |
6.35 |
6.29 - 6.43 |
0.8037 times |
Fri 17 October 2025 |
6.31 (-0.16%) |
6.30 |
6.26 - 6.37 |
1.1351 times |
Thu 16 October 2025 |
6.32 (-1.1%) |
6.40 |
6.27 - 6.44 |
0.9768 times |
Wed 15 October 2025 |
6.39 (1.11%) |
6.36 |
6.34 - 6.49 |
0.8338 times |
Tue 14 October 2025 |
6.32 (0.32%) |
6.19 |
6.15 - 6.38 |
1.0386 times |
Mon 13 October 2025 |
6.30 (1.12%) |
6.36 |
6.20 - 6.41 |
0.9704 times |
Fri 10 October 2025 |
6.23 (-2.5%) |
6.38 |
6.21 - 6.41 |
1.1125 times |
Thu 09 October 2025 |
6.39 (-0.47%) |
6.42 |
6.34 - 6.47 |
0.8918 times |
Wed 08 October 2025 |
6.42 (-0.16%) |
6.49 |
6.38 - 6.53 |
1.0369 times |
Tue 07 October 2025 |
6.43 (-1.08%) |
6.48 |
6.41 - 6.54 |
1.3298 times |
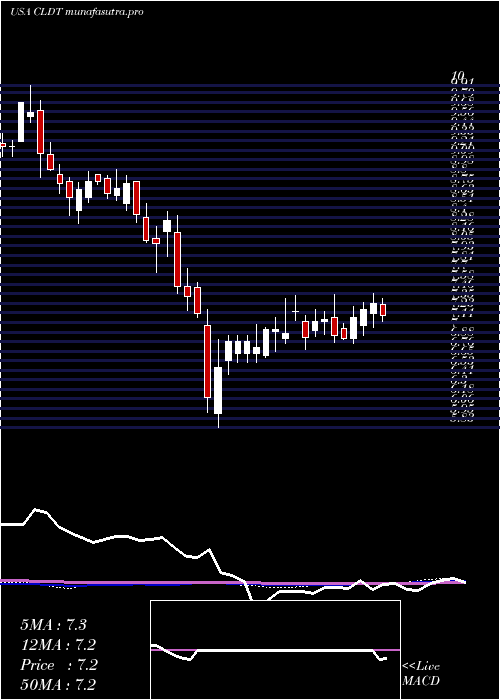
Weekly price and charts ChathamLodging Strong weekly Stock price targets for ChathamLodging CLDT are 6.38 and 6.62 | Weekly Target 1 | 6.19 | | Weekly Target 2 | 6.33 | | Weekly Target 3 | 6.43 | | Weekly Target 4 | 6.57 | | Weekly Target 5 | 6.67 |
Weekly price and volumes for Chatham Lodging
| Date |
Closing |
Open |
Range |
Volume |
Tue 21 October 2025 |
6.47 (2.54%) |
6.35 |
6.29 - 6.53 |
0.4465 times |
Fri 17 October 2025 |
6.31 (1.28%) |
6.36 |
6.15 - 6.49 |
1.1037 times |
Fri 10 October 2025 |
6.23 (-4.89%) |
6.64 |
6.21 - 6.64 |
1.255 times |
Fri 03 October 2025 |
6.55 (-6.03%) |
6.98 |
6.51 - 6.98 |
1.1801 times |
Fri 26 September 2025 |
6.97 (-1.83%) |
7.05 |
6.90 - 7.20 |
0.8704 times |
Fri 19 September 2025 |
7.10 (-0.14%) |
7.09 |
6.87 - 7.16 |
1.6645 times |
Fri 12 September 2025 |
7.11 (-4.05%) |
7.45 |
7.07 - 7.45 |
0.7398 times |
Fri 05 September 2025 |
7.41 (-2.88%) |
7.57 |
7.39 - 7.63 |
0.6651 times |
Fri 29 August 2025 |
7.63 (0%) |
7.67 |
7.58 - 7.69 |
0.4916 times |
Fri 29 August 2025 |
7.63 (-0.26%) |
7.64 |
7.57 - 7.82 |
1.5834 times |
Fri 22 August 2025 |
7.65 (7.9%) |
7.07 |
7.07 - 7.68 |
0.8472 times |
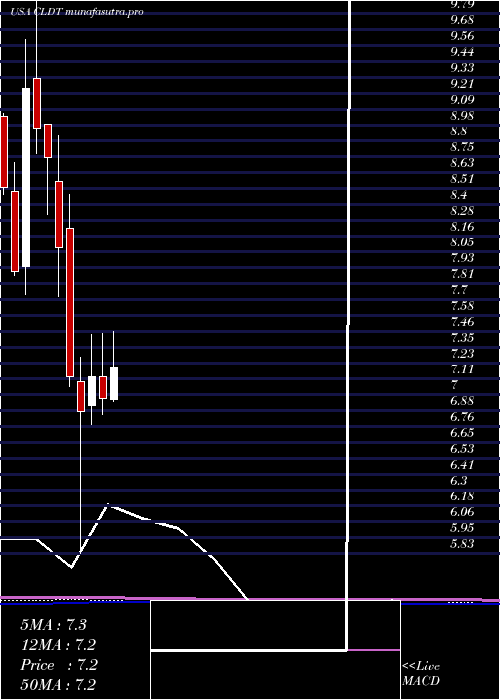
Monthly price and charts ChathamLodging Strong monthly Stock price targets for ChathamLodging CLDT are 6.02 and 6.6 | Monthly Target 1 | 5.87 | | Monthly Target 2 | 6.17 | | Monthly Target 3 | 6.45 | | Monthly Target 4 | 6.75 | | Monthly Target 5 | 7.03 |
Monthly price and volumes Chatham Lodging
| Date |
Closing |
Open |
Range |
Volume |
Tue 21 October 2025 |
6.47 (-3.58%) |
6.64 |
6.15 - 6.73 |
0.7663 times |
Tue 30 September 2025 |
6.71 (-12.06%) |
7.57 |
6.66 - 7.63 |
0.9598 times |
Fri 29 August 2025 |
7.63 (11.88%) |
6.74 |
6.59 - 7.82 |
0.9856 times |
Thu 31 July 2025 |
6.82 (-2.15%) |
6.96 |
6.65 - 7.46 |
0.74 times |
Mon 30 June 2025 |
6.97 (-2.24%) |
7.13 |
6.85 - 7.45 |
0.847 times |
Fri 30 May 2025 |
7.13 (3.78%) |
6.92 |
6.78 - 7.44 |
0.9613 times |
Wed 30 April 2025 |
6.87 (-3.65%) |
7.09 |
5.83 - 7.27 |
1.4709 times |
Mon 31 March 2025 |
7.13 (-11.76%) |
8.22 |
7.06 - 8.47 |
1.2248 times |
Fri 28 February 2025 |
8.08 (-7.55%) |
8.56 |
7.72 - 8.90 |
1.1661 times |
Fri 31 January 2025 |
8.74 (-2.35%) |
8.98 |
8.32 - 8.98 |
0.878 times |
Tue 31 December 2024 |
8.95 (-3.24%) |
9.32 |
8.77 - 10.00 |
0.6326 times |
DMA SMA EMA moving averages of Chatham Lodging CLDT
DMA (daily moving average) of Chatham Lodging CLDT
| DMA period | DMA value | | 5 day DMA | 6.38 | | 12 day DMA | 6.38 | | 20 day DMA | 6.54 | | 35 day DMA | 6.82 | | 50 day DMA | 7 | | 100 day DMA | 7.05 | | 150 day DMA | 7.03 | | 200 day DMA | 7.38 | EMA (exponential moving average) of Chatham Lodging CLDT
| EMA period | EMA current | EMA prev | EMA prev2 | | 5 day EMA | 6.4 | 6.37 | 6.34 | | 12 day EMA | 6.44 | 6.44 | 6.44 | | 20 day EMA | 6.55 | 6.56 | 6.57 | | 35 day EMA | 6.72 | 6.74 | 6.76 | | 50 day EMA | 6.92 | 6.94 | 6.96 |
SMA (simple moving average) of Chatham Lodging CLDT
| SMA period | SMA current | SMA prev | SMA prev2 | | 5 day SMA | 6.38 | 6.35 | 6.33 | | 12 day SMA | 6.38 | 6.38 | 6.4 | | 20 day SMA | 6.54 | 6.57 | 6.6 | | 35 day SMA | 6.82 | 6.85 | 6.88 | | 50 day SMA | 7 | 7.01 | 7.02 | | 100 day SMA | 7.05 | 7.05 | 7.06 | | 150 day SMA | 7.03 | 7.04 | 7.04 | | 200 day SMA | 7.38 | 7.4 | 7.41 |
|
|
