ColumbiaFinancial CLBK full analysis,charts,indicators,moving averages,SMA,DMA,EMA,ADX,MACD,RSIColumbia Financial CLBK WideScreen charts, DMA,SMA,EMA technical analysis, forecast prediction, by indicators ADX,MACD,RSI,CCI USA stock exchange
operates under Finance sector & deals in Savings Institutions
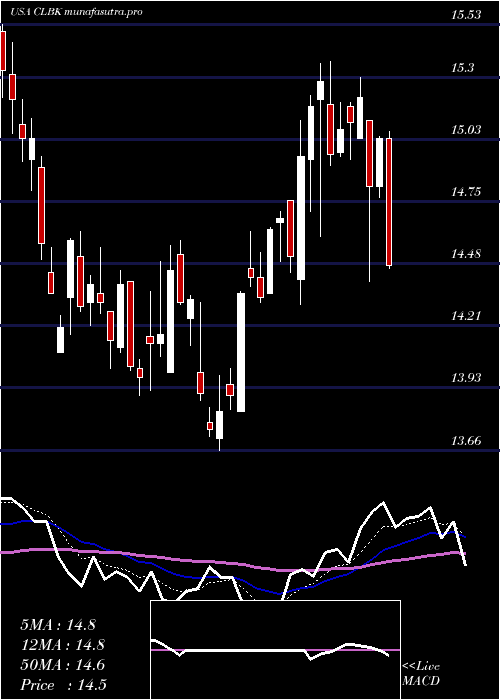
Daily price and charts and targets ColumbiaFinancial Strong Daily Stock price targets for ColumbiaFinancial CLBK are 16.7 and 16.95 | Daily Target 1 | 16.65 | | Daily Target 2 | 16.75 | | Daily Target 3 | 16.9 | | Daily Target 4 | 17 | | Daily Target 5 | 17.15 |
Daily price and volume Columbia Financial
| Date |
Closing |
Open |
Range |
Volume |
Thu 04 December 2025 |
16.85 (-0.65%) |
16.88 |
16.80 - 17.05 |
0.8041 times |
Wed 03 December 2025 |
16.96 (4.31%) |
16.34 |
16.34 - 16.96 |
0.8024 times |
Tue 02 December 2025 |
16.26 (0.56%) |
16.29 |
16.16 - 16.39 |
0.6255 times |
Mon 01 December 2025 |
16.17 (2.15%) |
15.74 |
15.68 - 16.18 |
1.2536 times |
Fri 28 November 2025 |
15.83 (-0.5%) |
16.00 |
15.79 - 16.05 |
0.629 times |
Wed 26 November 2025 |
15.91 (-0.93%) |
15.99 |
15.89 - 16.29 |
0.7503 times |
Tue 25 November 2025 |
16.06 (2.16%) |
15.82 |
15.21 - 16.20 |
1.0716 times |
Mon 24 November 2025 |
15.72 (1.48%) |
15.58 |
15.36 - 15.74 |
1.4459 times |
Fri 21 November 2025 |
15.49 (3.2%) |
15.02 |
14.52 - 15.74 |
1.6801 times |
Thu 20 November 2025 |
15.01 (1.83%) |
14.94 |
14.87 - 15.22 |
0.9374 times |
Wed 19 November 2025 |
14.74 (0.07%) |
14.69 |
14.55 - 15.10 |
1.0067 times |
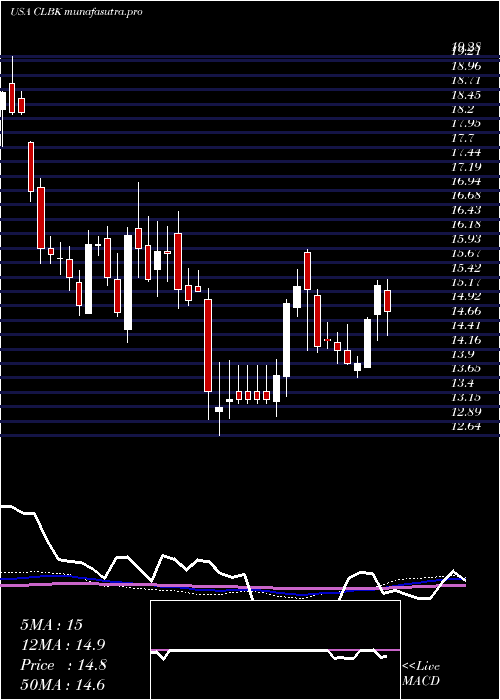
Weekly price and charts ColumbiaFinancial Strong weekly Stock price targets for ColumbiaFinancial CLBK are 16.27 and 17.64 | Weekly Target 1 | 15.16 | | Weekly Target 2 | 16 | | Weekly Target 3 | 16.526666666667 | | Weekly Target 4 | 17.37 | | Weekly Target 5 | 17.9 |
Weekly price and volumes for Columbia Financial
| Date |
Closing |
Open |
Range |
Volume |
Thu 04 December 2025 |
16.85 (6.44%) |
15.74 |
15.68 - 17.05 |
0.7308 times |
Fri 28 November 2025 |
15.83 (2.19%) |
15.58 |
15.21 - 16.29 |
0.8169 times |
Fri 21 November 2025 |
15.49 (2.86%) |
15.09 |
14.43 - 15.74 |
1.1372 times |
Fri 14 November 2025 |
15.06 (-1.12%) |
15.33 |
14.81 - 15.60 |
1.0763 times |
Fri 07 November 2025 |
15.23 (3.25%) |
14.88 |
14.82 - 15.49 |
0.7802 times |
Fri 31 October 2025 |
14.75 (0%) |
15.05 |
14.64 - 15.29 |
0.2874 times |
Fri 31 October 2025 |
14.75 (-4.35%) |
15.52 |
14.56 - 15.55 |
1.1654 times |
Fri 24 October 2025 |
15.42 (12.31%) |
13.92 |
13.84 - 15.50 |
1.162 times |
Fri 17 October 2025 |
13.73 (-1.29%) |
14.13 |
13.66 - 14.72 |
1.4646 times |
Fri 10 October 2025 |
13.91 (-6.58%) |
14.96 |
13.90 - 15.47 |
1.3793 times |
Fri 03 October 2025 |
14.89 (-2.68%) |
15.38 |
14.57 - 15.38 |
0.9183 times |
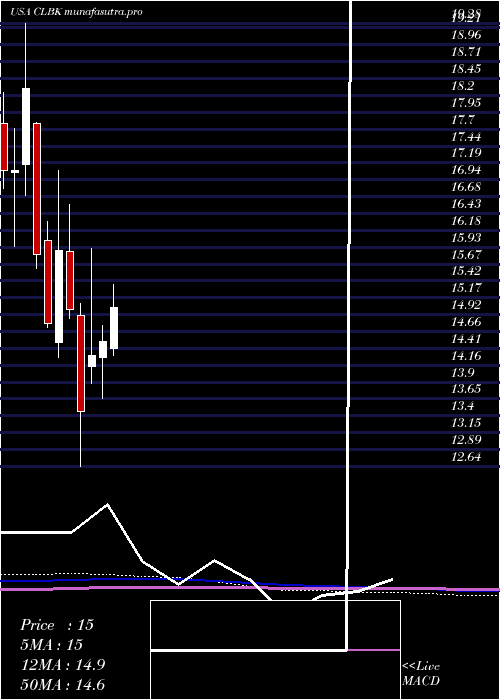
Monthly price and charts ColumbiaFinancial Strong monthly Stock price targets for ColumbiaFinancial CLBK are 16.27 and 17.64 | Monthly Target 1 | 15.16 | | Monthly Target 2 | 16 | | Monthly Target 3 | 16.526666666667 | | Monthly Target 4 | 17.37 | | Monthly Target 5 | 17.9 |
Monthly price and volumes Columbia Financial
| Date |
Closing |
Open |
Range |
Volume |
Thu 04 December 2025 |
16.85 (6.44%) |
15.74 |
15.68 - 17.05 |
0.1632 times |
Fri 28 November 2025 |
15.83 (7.32%) |
14.88 |
14.43 - 16.29 |
0.8511 times |
Fri 31 October 2025 |
14.75 (-1.73%) |
14.87 |
13.66 - 15.55 |
1.3365 times |
Tue 30 September 2025 |
15.01 (-0.13%) |
14.87 |
14.62 - 15.97 |
1.1682 times |
Fri 29 August 2025 |
15.03 (4.45%) |
14.23 |
13.98 - 15.37 |
0.8849 times |
Thu 31 July 2025 |
14.39 (-0.83%) |
14.41 |
13.89 - 15.37 |
0.8956 times |
Mon 30 June 2025 |
14.51 (1.4%) |
14.27 |
13.66 - 14.76 |
1.0102 times |
Fri 30 May 2025 |
14.31 (6.24%) |
14.14 |
13.88 - 15.91 |
1.0407 times |
Wed 30 April 2025 |
13.47 (-10.2%) |
14.91 |
12.64 - 15.08 |
1.7788 times |
Mon 31 March 2025 |
15.00 (-5.48%) |
15.86 |
14.86 - 16.57 |
0.8708 times |
Fri 28 February 2025 |
15.87 (7.3%) |
14.50 |
14.28 - 17.08 |
0.8239 times |
DMA SMA EMA moving averages of Columbia Financial CLBK
DMA (daily moving average) of Columbia Financial CLBK
| DMA period | DMA value | | 5 day DMA | 16.41 | | 12 day DMA | 15.81 | | 20 day DMA | 15.53 | | 35 day DMA | 15.25 | | 50 day DMA | 15.11 | | 100 day DMA | 14.99 | | 150 day DMA | 14.88 | | 200 day DMA | 14.79 | EMA (exponential moving average) of Columbia Financial CLBK
| EMA period | EMA current | EMA prev | EMA prev2 | | 5 day EMA | 16.5 | 16.32 | 16 | | 12 day EMA | 16.02 | 15.87 | 15.67 | | 20 day EMA | 15.73 | 15.61 | 15.47 | | 35 day EMA | 15.47 | 15.39 | 15.3 | | 50 day EMA | 15.28 | 15.22 | 15.15 |
SMA (simple moving average) of Columbia Financial CLBK
| SMA period | SMA current | SMA prev | SMA prev2 | | 5 day SMA | 16.41 | 16.23 | 16.05 | | 12 day SMA | 15.81 | 15.62 | 15.46 | | 20 day SMA | 15.53 | 15.46 | 15.36 | | 35 day SMA | 15.25 | 15.18 | 15.11 | | 50 day SMA | 15.11 | 15.09 | 15.06 | | 100 day SMA | 14.99 | 14.97 | 14.95 | | 150 day SMA | 14.88 | 14.86 | 14.84 | | 200 day SMA | 14.79 | 14.79 | 14.78 |
|
|
