ChsInc CHSCP full analysis,charts,indicators,moving averages,SMA,DMA,EMA,ADX,MACD,RSIChs Inc CHSCP WideScreen charts, DMA,SMA,EMA technical analysis, forecast prediction, by indicators ADX,MACD,RSI,CCI USA stock exchange
operates under Consumer Services sector & deals in Farming Seeds Milling
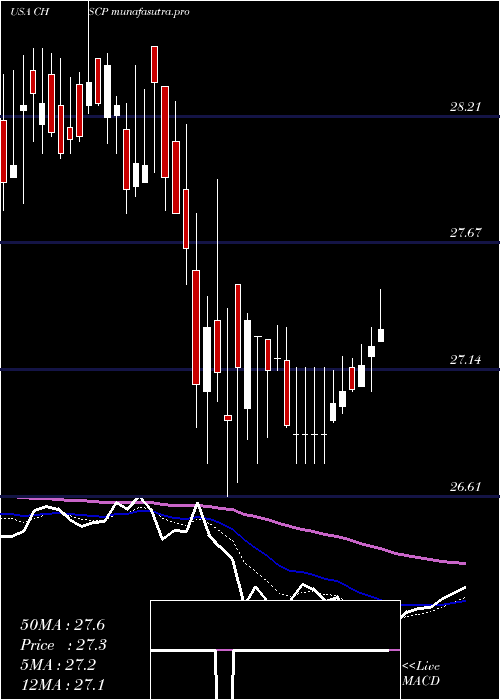
Daily price and charts and targets ChsInc Strong Daily Stock price targets for ChsInc CHSCP are 29 and 29.61 | Daily Target 1 | 28.54 | | Daily Target 2 | 28.85 | | Daily Target 3 | 29.146666666667 | | Daily Target 4 | 29.46 | | Daily Target 5 | 29.76 |
Daily price and volume Chs Inc
| Date |
Closing |
Open |
Range |
Volume |
Tue 21 October 2025 |
29.17 (1.18%) |
28.99 |
28.83 - 29.44 |
0.6376 times |
Mon 20 October 2025 |
28.83 (0.95%) |
28.67 |
28.67 - 29.00 |
0.8554 times |
Fri 17 October 2025 |
28.56 (-1.01%) |
28.71 |
28.50 - 28.74 |
1.1353 times |
Thu 16 October 2025 |
28.85 (0.49%) |
28.71 |
28.71 - 29.01 |
0.5443 times |
Wed 15 October 2025 |
28.71 (-0.59%) |
29.13 |
28.69 - 29.35 |
3.0482 times |
Tue 14 October 2025 |
28.88 (-0.17%) |
28.71 |
28.71 - 29.21 |
0.6065 times |
Mon 13 October 2025 |
28.93 (0.45%) |
28.91 |
28.68 - 28.93 |
0.3577 times |
Fri 10 October 2025 |
28.80 (-1.5%) |
29.12 |
28.75 - 29.30 |
1.2131 times |
Thu 09 October 2025 |
29.24 (-0.58%) |
29.31 |
29.22 - 29.38 |
0.8243 times |
Wed 08 October 2025 |
29.41 (-0.07%) |
29.36 |
29.31 - 29.54 |
0.7776 times |
Tue 07 October 2025 |
29.43 (-0.54%) |
29.64 |
29.40 - 29.68 |
1.3219 times |
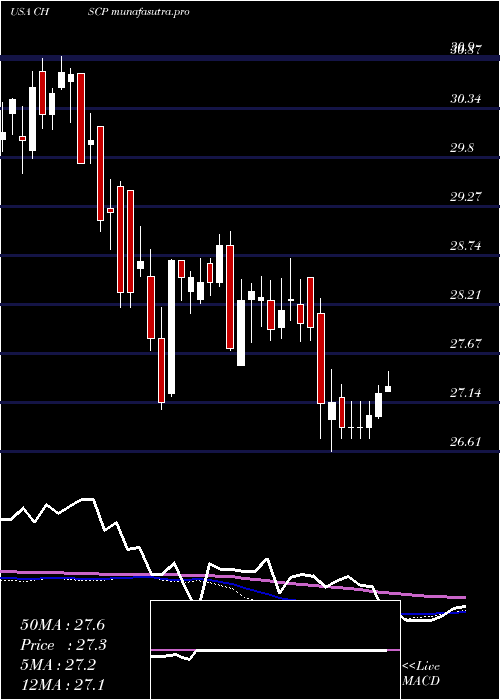
Weekly price and charts ChsInc Strong weekly Stock price targets for ChsInc CHSCP are 28.92 and 29.69 | Weekly Target 1 | 28.32 | | Weekly Target 2 | 28.75 | | Weekly Target 3 | 29.093333333333 | | Weekly Target 4 | 29.52 | | Weekly Target 5 | 29.86 |
Weekly price and volumes for Chs Inc
| Date |
Closing |
Open |
Range |
Volume |
Tue 21 October 2025 |
29.17 (2.14%) |
28.67 |
28.67 - 29.44 |
0.1913 times |
Fri 17 October 2025 |
28.56 (-0.83%) |
28.91 |
28.50 - 29.35 |
0.7294 times |
Fri 10 October 2025 |
28.80 (-2.6%) |
29.65 |
28.75 - 29.70 |
0.6836 times |
Fri 03 October 2025 |
29.57 (-0.44%) |
29.90 |
29.34 - 30.08 |
1.2969 times |
Fri 26 September 2025 |
29.70 (-0.37%) |
29.71 |
29.56 - 30.00 |
0.8012 times |
Fri 19 September 2025 |
29.81 (-1.62%) |
30.31 |
29.53 - 30.57 |
1.3572 times |
Fri 12 September 2025 |
30.30 (4.74%) |
29.06 |
28.83 - 30.37 |
1.2795 times |
Fri 05 September 2025 |
28.93 (1.65%) |
28.46 |
28.40 - 29.05 |
0.5401 times |
Fri 29 August 2025 |
28.46 (0%) |
28.80 |
28.45 - 29.30 |
1.3532 times |
Fri 29 August 2025 |
28.46 (-1.39%) |
28.80 |
28.45 - 29.30 |
1.7677 times |
Fri 22 August 2025 |
28.86 (0.03%) |
28.71 |
28.68 - 30.27 |
0.7613 times |
Monthly price and charts ChsInc Strong monthly Stock price targets for ChsInc CHSCP are 28.1 and 29.58 | Monthly Target 1 | 27.74 | | Monthly Target 2 | 28.45 | | Monthly Target 3 | 29.216666666667 | | Monthly Target 4 | 29.93 | | Monthly Target 5 | 30.7 |
Monthly price and volumes Chs Inc
| Date |
Closing |
Open |
Range |
Volume |
Tue 21 October 2025 |
29.17 (-1.82%) |
29.75 |
28.50 - 29.98 |
0.3643 times |
Tue 30 September 2025 |
29.71 (4.39%) |
28.46 |
28.40 - 30.57 |
0.9178 times |
Fri 29 August 2025 |
28.46 (0.25%) |
28.30 |
28.08 - 30.27 |
0.9015 times |
Thu 31 July 2025 |
28.39 (3.05%) |
27.55 |
27.33 - 28.74 |
0.8294 times |
Mon 30 June 2025 |
27.55 (0.84%) |
27.40 |
27.24 - 28.00 |
1.0504 times |
Fri 30 May 2025 |
27.32 (0.59%) |
27.35 |
27.10 - 27.97 |
0.8959 times |
Wed 30 April 2025 |
27.16 (-2.3%) |
27.90 |
26.61 - 28.17 |
1.3542 times |
Mon 31 March 2025 |
27.80 (-0.47%) |
27.95 |
27.80 - 28.70 |
1.1197 times |
Fri 28 February 2025 |
27.93 (0.76%) |
27.54 |
27.54 - 28.51 |
1.0512 times |
Fri 31 January 2025 |
27.72 (-1.74%) |
28.51 |
27.70 - 28.99 |
1.5155 times |
Tue 31 December 2024 |
28.21 (-0.42%) |
28.60 |
27.06 - 29.05 |
1.1495 times |

DMA SMA EMA moving averages of Chs Inc CHSCP
DMA (daily moving average) of Chs Inc CHSCP
| DMA period | DMA value | | 5 day DMA | 28.82 | | 12 day DMA | 29.03 | | 20 day DMA | 29.31 | | 35 day DMA | 29.45 | | 50 day DMA | 29.25 | | 100 day DMA | 28.53 | | 150 day DMA | 28.15 | | 200 day DMA | 28.2 | EMA (exponential moving average) of Chs Inc CHSCP
| EMA period | EMA current | EMA prev | EMA prev2 | | 5 day EMA | 28.92 | 28.8 | 28.79 | | 12 day EMA | 29.04 | 29.02 | 29.05 | | 20 day EMA | 29.17 | 29.17 | 29.21 | | 35 day EMA | 29.16 | 29.16 | 29.18 | | 50 day EMA | 29.16 | 29.16 | 29.17 |
SMA (simple moving average) of Chs Inc CHSCP
| SMA period | SMA current | SMA prev | SMA prev2 | | 5 day SMA | 28.82 | 28.77 | 28.79 | | 12 day SMA | 29.03 | 29.07 | 29.14 | | 20 day SMA | 29.31 | 29.33 | 29.37 | | 35 day SMA | 29.45 | 29.43 | 29.42 | | 50 day SMA | 29.25 | 29.24 | 29.23 | | 100 day SMA | 28.53 | 28.52 | 28.51 | | 150 day SMA | 28.15 | 28.15 | 28.14 | | 200 day SMA | 28.2 | 28.2 | 28.2 |
|
|
