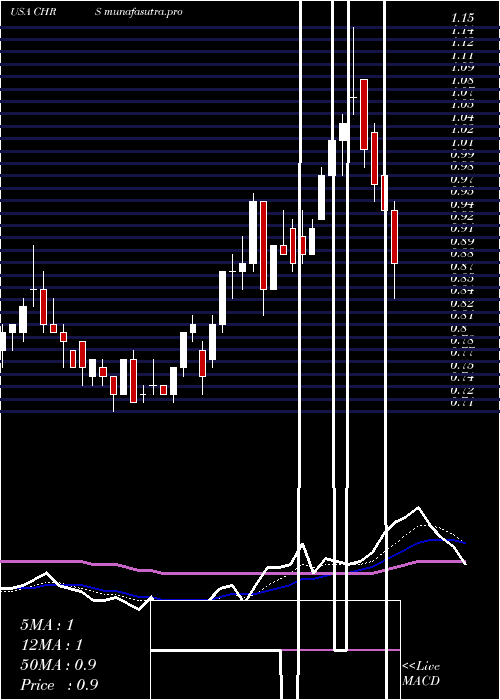
CoherusBiosciences CHRS full analysis,charts,indicators,moving averages,SMA,DMA,EMA,ADX,MACD,RSICoherus Biosciences CHRS WideScreen charts, DMA,SMA,EMA technical analysis, forecast prediction, by indicators ADX,MACD,RSI,CCI USA stock exchange
operates under Health Care sector & deals in Biotechnology Biological Products No Diagnostic Substances
Daily price and charts and targets CoherusBiosciences Strong Daily Stock price targets for CoherusBiosciences CHRS are 1.68 and 1.78 | Daily Target 1 | 1.66 | | Daily Target 2 | 1.7 | | Daily Target 3 | 1.76 | | Daily Target 4 | 1.8 | | Daily Target 5 | 1.86 |
Daily price and volume Coherus Biosciences
| Date |
Closing |
Open |
Range |
Volume |
Tue 21 October 2025 |
1.74 (-2.79%) |
1.76 |
1.72 - 1.82 |
0.5201 times |
Mon 20 October 2025 |
1.79 (8.48%) |
1.66 |
1.65 - 1.79 |
0.9372 times |
Fri 17 October 2025 |
1.65 (-3.51%) |
1.70 |
1.63 - 1.71 |
0.811 times |
Thu 16 October 2025 |
1.71 (-3.93%) |
1.78 |
1.70 - 1.85 |
1.1322 times |
Wed 15 October 2025 |
1.78 (4.71%) |
1.73 |
1.69 - 1.80 |
0.8455 times |
Tue 14 October 2025 |
1.70 (-1.73%) |
1.70 |
1.66 - 1.73 |
0.7322 times |
Mon 13 October 2025 |
1.73 (3.59%) |
1.66 |
1.63 - 1.74 |
0.8648 times |
Fri 10 October 2025 |
1.67 (-8.24%) |
1.85 |
1.67 - 1.87 |
1.5275 times |
Thu 09 October 2025 |
1.82 (3.41%) |
1.78 |
1.78 - 1.89 |
1.5844 times |
Wed 08 October 2025 |
1.76 (2.92%) |
1.72 |
1.69 - 1.78 |
1.0451 times |
Tue 07 October 2025 |
1.71 (0.59%) |
1.69 |
1.63 - 1.72 |
1.1062 times |
Weekly price and charts CoherusBiosciences Strong weekly Stock price targets for CoherusBiosciences CHRS are 1.7 and 1.87 | Weekly Target 1 | 1.57 | | Weekly Target 2 | 1.65 | | Weekly Target 3 | 1.7366666666667 | | Weekly Target 4 | 1.82 | | Weekly Target 5 | 1.91 |
Weekly price and volumes for Coherus Biosciences
| Date |
Closing |
Open |
Range |
Volume |
Tue 21 October 2025 |
1.74 (5.45%) |
1.66 |
1.65 - 1.82 |
0.3003 times |
Fri 17 October 2025 |
1.65 (-1.2%) |
1.66 |
1.63 - 1.85 |
0.9036 times |
Fri 10 October 2025 |
1.67 (1.83%) |
1.65 |
1.61 - 1.89 |
1.3412 times |
Fri 03 October 2025 |
1.64 (9.33%) |
1.55 |
1.48 - 1.72 |
1.1255 times |
Fri 26 September 2025 |
1.50 (-6.83%) |
1.62 |
1.37 - 1.65 |
1.184 times |
Fri 19 September 2025 |
1.61 (24.81%) |
1.29 |
1.23 - 1.68 |
1.8088 times |
Fri 12 September 2025 |
1.29 (0%) |
1.29 |
1.28 - 1.40 |
0.8854 times |
Fri 05 September 2025 |
1.29 (11.21%) |
1.15 |
1.13 - 1.39 |
1.2562 times |
Fri 29 August 2025 |
1.16 (0%) |
1.18 |
1.14 - 1.18 |
0.1005 times |
Fri 29 August 2025 |
1.16 (-5.69%) |
1.22 |
1.09 - 1.26 |
1.0946 times |
Fri 22 August 2025 |
1.23 (17.14%) |
1.05 |
1.03 - 1.24 |
1.5915 times |

Monthly price and charts CoherusBiosciences Strong monthly Stock price targets for CoherusBiosciences CHRS are 1.65 and 1.98 | Monthly Target 1 | 1.4 | | Monthly Target 2 | 1.57 | | Monthly Target 3 | 1.73 | | Monthly Target 4 | 1.9 | | Monthly Target 5 | 2.06 |
Monthly price and volumes Coherus Biosciences
| Date |
Closing |
Open |
Range |
Volume |
Tue 21 October 2025 |
1.74 (6.1%) |
1.60 |
1.56 - 1.89 |
0.4869 times |
Tue 30 September 2025 |
1.64 (41.38%) |
1.15 |
1.13 - 1.72 |
0.9249 times |
Fri 29 August 2025 |
1.16 (23.4%) |
0.94 |
0.81 - 1.26 |
0.9002 times |
Thu 31 July 2025 |
0.94 (28.77%) |
0.73 |
0.72 - 1.15 |
0.9649 times |
Mon 30 June 2025 |
0.73 (-6.41%) |
0.78 |
0.71 - 0.90 |
0.8077 times |
Fri 30 May 2025 |
0.78 (-24.27%) |
1.02 |
0.71 - 1.12 |
1.0072 times |
Wed 30 April 2025 |
1.03 (27.16%) |
0.80 |
0.72 - 1.14 |
1.206 times |
Mon 31 March 2025 |
0.81 (-27.03%) |
1.11 |
0.79 - 1.18 |
1.2738 times |
Fri 28 February 2025 |
1.11 (-5.93%) |
1.12 |
1.03 - 1.24 |
0.7656 times |
Fri 31 January 2025 |
1.18 (-14.49%) |
1.43 |
1.03 - 1.77 |
1.6628 times |
Tue 31 December 2024 |
1.38 (7.81%) |
1.78 |
1.35 - 1.85 |
1.4533 times |

DMA SMA EMA moving averages of Coherus Biosciences CHRS
DMA (daily moving average) of Coherus Biosciences CHRS
| DMA period | DMA value | | 5 day DMA | 1.73 | | 12 day DMA | 1.73 | | 20 day DMA | 1.68 | | 35 day DMA | 1.55 | | 50 day DMA | 1.42 | | 100 day DMA | 1.13 | | 150 day DMA | 1.06 | | 200 day DMA | 1.1 | EMA (exponential moving average) of Coherus Biosciences CHRS
| EMA period | EMA current | EMA prev | EMA prev2 | | 5 day EMA | 1.73 | 1.73 | 1.7 | | 12 day EMA | 1.71 | 1.7 | 1.68 | | 20 day EMA | 1.66 | 1.65 | 1.64 | | 35 day EMA | 1.55 | 1.54 | 1.52 | | 50 day EMA | 1.41 | 1.4 | 1.38 |
SMA (simple moving average) of Coherus Biosciences CHRS
| SMA period | SMA current | SMA prev | SMA prev2 | | 5 day SMA | 1.73 | 1.73 | 1.71 | | 12 day SMA | 1.73 | 1.72 | 1.71 | | 20 day SMA | 1.68 | 1.67 | 1.66 | | 35 day SMA | 1.55 | 1.54 | 1.52 | | 50 day SMA | 1.42 | 1.4 | 1.39 | | 100 day SMA | 1.13 | 1.12 | 1.11 | | 150 day SMA | 1.06 | 1.06 | 1.05 | | 200 day SMA | 1.1 | 1.09 | 1.09 |
|
|
