ChemungFinancial CHMG full analysis,charts,indicators,moving averages,SMA,DMA,EMA,ADX,MACD,RSIChemung Financial CHMG WideScreen charts, DMA,SMA,EMA technical analysis, forecast prediction, by indicators ADX,MACD,RSI,CCI USA stock exchange
operates under Finance sector & deals in Major Banks
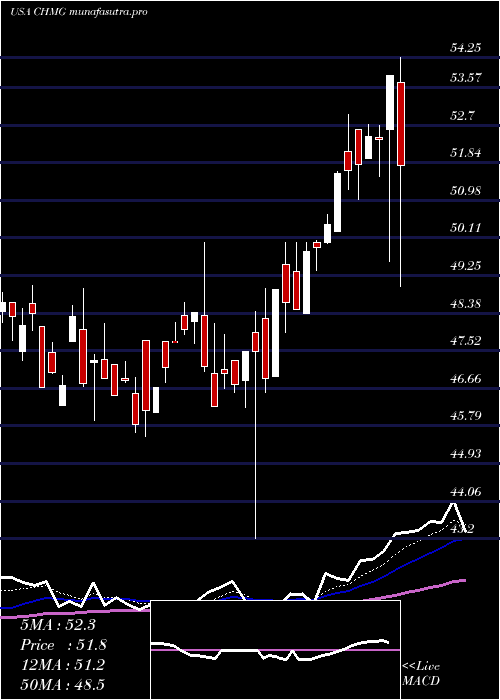
Daily price and charts and targets ChemungFinancial Strong Daily Stock price targets for ChemungFinancial CHMG are 53.08 and 53.53 | Daily Target 1 | 52.7 | | Daily Target 2 | 53 | | Daily Target 3 | 53.15 | | Daily Target 4 | 53.45 | | Daily Target 5 | 53.6 |
Daily price and volume Chemung Financial
| Date |
Closing |
Open |
Range |
Volume |
Fri 05 December 2025 |
53.30 (-0.54%) |
52.85 |
52.85 - 53.30 |
0.6067 times |
Thu 04 December 2025 |
53.59 (-0.07%) |
53.27 |
52.88 - 53.76 |
0.9785 times |
Wed 03 December 2025 |
53.63 (2.54%) |
52.78 |
52.78 - 53.63 |
3.4149 times |
Tue 02 December 2025 |
52.30 (-0.25%) |
52.88 |
52.30 - 52.88 |
0.5382 times |
Mon 01 December 2025 |
52.43 (-0.46%) |
52.31 |
52.15 - 52.50 |
0.5871 times |
Fri 28 November 2025 |
52.67 (0.96%) |
52.11 |
52.11 - 52.67 |
0.3229 times |
Wed 26 November 2025 |
52.17 (0.38%) |
52.45 |
52.17 - 53.02 |
0.636 times |
Tue 25 November 2025 |
51.97 (0.56%) |
51.55 |
51.42 - 52.53 |
0.7926 times |
Mon 24 November 2025 |
51.68 (-2.49%) |
52.35 |
51.16 - 52.35 |
0.6751 times |
Fri 21 November 2025 |
53.00 (4.74%) |
50.50 |
50.50 - 53.00 |
1.4481 times |
Thu 20 November 2025 |
50.60 (-0.02%) |
50.86 |
50.50 - 50.93 |
0.6947 times |
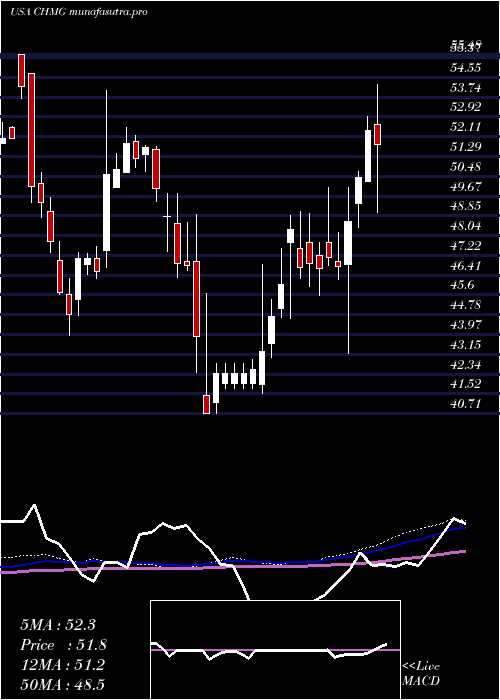
Weekly price and charts ChemungFinancial Strong weekly Stock price targets for ChemungFinancial CHMG are 52.73 and 54.34 | Weekly Target 1 | 51.46 | | Weekly Target 2 | 52.38 | | Weekly Target 3 | 53.07 | | Weekly Target 4 | 53.99 | | Weekly Target 5 | 54.68 |
Weekly price and volumes for Chemung Financial
| Date |
Closing |
Open |
Range |
Volume |
Fri 05 December 2025 |
53.30 (1.2%) |
52.31 |
52.15 - 53.76 |
2.0411 times |
Fri 28 November 2025 |
52.67 (-0.62%) |
52.35 |
51.16 - 53.02 |
0.8086 times |
Fri 21 November 2025 |
53.00 (2.73%) |
50.50 |
50.50 - 53.00 |
1.3629 times |
Fri 14 November 2025 |
51.59 (1.58%) |
51.20 |
50.21 - 52.55 |
1.0955 times |
Fri 07 November 2025 |
50.79 (0.24%) |
50.54 |
50.29 - 51.39 |
0.7499 times |
Fri 31 October 2025 |
50.67 (0%) |
50.37 |
50.21 - 51.07 |
0.1337 times |
Fri 31 October 2025 |
50.67 (-4.58%) |
53.58 |
50.21 - 53.58 |
0.8608 times |
Fri 24 October 2025 |
53.10 (6.12%) |
50.53 |
50.41 - 53.10 |
0.8216 times |
Fri 17 October 2025 |
50.04 (-0.24%) |
50.37 |
49.82 - 52.39 |
1.0955 times |
Fri 10 October 2025 |
50.16 (-4.51%) |
52.90 |
50.05 - 53.00 |
1.0303 times |
Fri 03 October 2025 |
52.53 (-1.63%) |
52.71 |
52.05 - 52.93 |
0.9264 times |
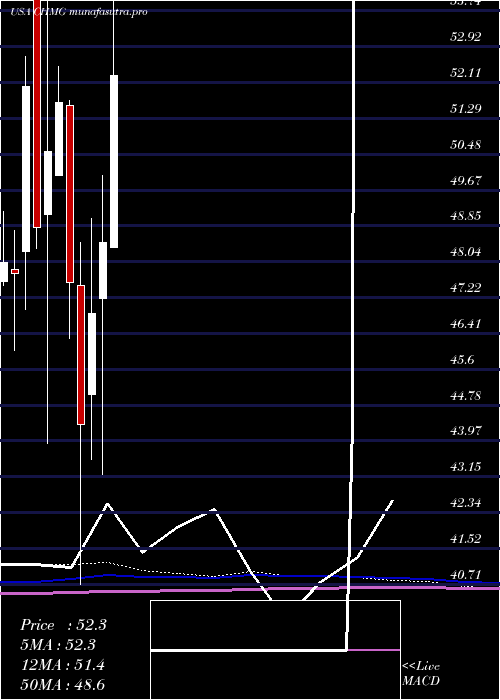
Monthly price and charts ChemungFinancial Strong monthly Stock price targets for ChemungFinancial CHMG are 52.73 and 54.34 | Monthly Target 1 | 51.46 | | Monthly Target 2 | 52.38 | | Monthly Target 3 | 53.07 | | Monthly Target 4 | 53.99 | | Monthly Target 5 | 54.68 |
Monthly price and volumes Chemung Financial
| Date |
Closing |
Open |
Range |
Volume |
Fri 05 December 2025 |
53.30 (1.2%) |
52.31 |
52.15 - 53.76 |
0.271 times |
Fri 28 November 2025 |
52.67 (3.95%) |
50.54 |
50.21 - 53.02 |
0.5333 times |
Fri 31 October 2025 |
50.67 (-3.52%) |
52.50 |
49.82 - 53.58 |
0.5948 times |
Tue 30 September 2025 |
52.52 (-2.6%) |
53.50 |
52.20 - 54.77 |
0.9142 times |
Fri 29 August 2025 |
53.92 (6.56%) |
49.55 |
48.61 - 54.20 |
0.7211 times |
Thu 31 July 2025 |
50.60 (4.39%) |
48.37 |
48.37 - 54.25 |
1.7741 times |
Mon 30 June 2025 |
48.47 (3.41%) |
47.21 |
43.20 - 50.00 |
1.1635 times |
Fri 30 May 2025 |
46.87 (5.71%) |
45.01 |
43.55 - 49.02 |
0.9501 times |
Wed 30 April 2025 |
44.34 (-6.79%) |
47.50 |
40.71 - 48.48 |
1.0387 times |
Mon 31 March 2025 |
47.57 (-7.9%) |
51.60 |
46.30 - 51.70 |
2.0393 times |
Fri 28 February 2025 |
51.65 (2.18%) |
50.00 |
50.00 - 52.47 |
1.1509 times |
DMA SMA EMA moving averages of Chemung Financial CHMG
DMA (daily moving average) of Chemung Financial CHMG
| DMA period | DMA value | | 5 day DMA | 53.05 | | 12 day DMA | 52.33 | | 20 day DMA | 51.89 | | 35 day DMA | 51.58 | | 50 day DMA | 51.71 | | 100 day DMA | 52 | | 150 day DMA | 50.72 | | 200 day DMA | 49.64 | EMA (exponential moving average) of Chemung Financial CHMG
| EMA period | EMA current | EMA prev | EMA prev2 | | 5 day EMA | 53.1 | 53 | 52.71 | | 12 day EMA | 52.54 | 52.4 | 52.18 | | 20 day EMA | 52.21 | 52.09 | 51.93 | | 35 day EMA | 52.03 | 51.95 | 51.85 | | 50 day EMA | 51.95 | 51.89 | 51.82 |
SMA (simple moving average) of Chemung Financial CHMG
| SMA period | SMA current | SMA prev | SMA prev2 | | 5 day SMA | 53.05 | 52.92 | 52.64 | | 12 day SMA | 52.33 | 52.11 | 51.85 | | 20 day SMA | 51.89 | 51.74 | 51.63 | | 35 day SMA | 51.58 | 51.48 | 51.44 | | 50 day SMA | 51.71 | 51.71 | 51.7 | | 100 day SMA | 52 | 51.99 | 51.97 | | 150 day SMA | 50.72 | 50.65 | 50.59 | | 200 day SMA | 49.64 | 49.63 | 49.62 |
|
|
