CheckPoint CHKP full analysis,charts,indicators,moving averages,SMA,DMA,EMA,ADX,MACD,RSICheck Point CHKP WideScreen charts, DMA,SMA,EMA technical analysis, forecast prediction, by indicators ADX,MACD,RSI,CCI USA stock exchange
operates under Technology sector & deals in Computer Software Prepackaged Software
Daily price and charts and targets CheckPoint Strong Daily Stock price targets for CheckPoint CHKP are 191.71 and 194.85 | Daily Target 1 | 189.13 | | Daily Target 2 | 191.14 | | Daily Target 3 | 192.27 | | Daily Target 4 | 194.28 | | Daily Target 5 | 195.41 |
Daily price and volume Check Point
| Date |
Closing |
Open |
Range |
Volume |
Mon 20 October 2025 |
193.15 (1.31%) |
191.01 |
190.26 - 193.40 |
1.1276 times |
Fri 17 October 2025 |
190.65 (1.22%) |
187.29 |
187.29 - 191.22 |
0.881 times |
Thu 16 October 2025 |
188.36 (-0.99%) |
190.53 |
187.55 - 191.79 |
0.9841 times |
Wed 15 October 2025 |
190.24 (-1.98%) |
194.64 |
189.77 - 195.04 |
1.0348 times |
Tue 14 October 2025 |
194.08 (-0.4%) |
194.04 |
193.43 - 196.71 |
0.8454 times |
Mon 13 October 2025 |
194.85 (-0.36%) |
196.61 |
193.59 - 197.35 |
0.7519 times |
Fri 10 October 2025 |
195.56 (-1.26%) |
198.05 |
193.51 - 199.19 |
0.9308 times |
Thu 09 October 2025 |
198.05 (-1.47%) |
201.00 |
196.55 - 201.00 |
1.0955 times |
Wed 08 October 2025 |
201.00 (0.28%) |
199.90 |
198.67 - 201.10 |
1.1131 times |
Tue 07 October 2025 |
200.44 (-0.26%) |
202.03 |
197.68 - 203.63 |
1.2358 times |
Mon 06 October 2025 |
200.96 (-0.3%) |
198.91 |
196.50 - 201.43 |
2.0613 times |
Weekly price and charts CheckPoint Strong weekly Stock price targets for CheckPoint CHKP are 191.71 and 194.85 | Weekly Target 1 | 189.13 | | Weekly Target 2 | 191.14 | | Weekly Target 3 | 192.27 | | Weekly Target 4 | 194.28 | | Weekly Target 5 | 195.41 |
Weekly price and volumes for Check Point
| Date |
Closing |
Open |
Range |
Volume |
Mon 20 October 2025 |
193.15 (1.31%) |
191.01 |
190.26 - 193.40 |
0.2594 times |
Fri 17 October 2025 |
190.65 (-2.51%) |
196.61 |
187.29 - 197.35 |
1.0347 times |
Fri 10 October 2025 |
195.56 (-2.98%) |
198.91 |
193.51 - 203.63 |
1.4809 times |
Fri 03 October 2025 |
201.57 (-1.51%) |
205.30 |
200.04 - 208.28 |
1.174 times |
Fri 26 September 2025 |
204.65 (3.47%) |
197.15 |
194.22 - 207.64 |
1.2061 times |
Fri 19 September 2025 |
197.79 (1.33%) |
194.88 |
194.62 - 200.99 |
1.6112 times |
Fri 12 September 2025 |
195.19 (1.09%) |
193.35 |
192.66 - 198.76 |
0.8787 times |
Fri 05 September 2025 |
193.09 (-0.03%) |
190.01 |
188.53 - 193.93 |
1.1014 times |
Fri 29 August 2025 |
193.14 (0%) |
191.54 |
191.54 - 193.86 |
0.1821 times |
Fri 29 August 2025 |
193.14 (1.43%) |
191.10 |
186.88 - 193.86 |
1.0715 times |
Fri 22 August 2025 |
190.42 (0.79%) |
189.60 |
186.25 - 191.68 |
1.279 times |
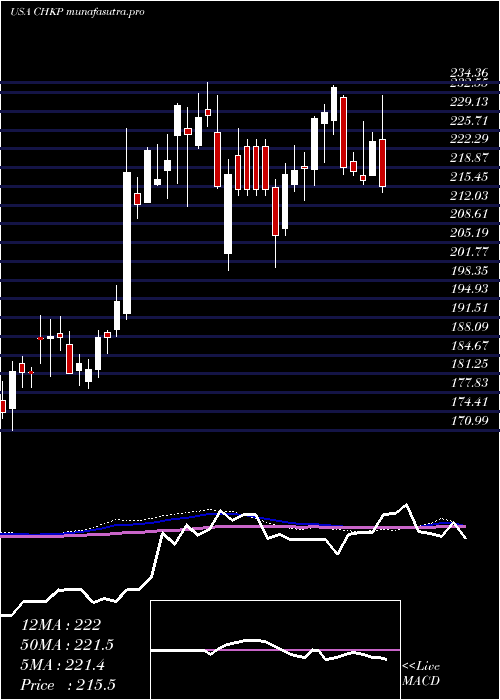
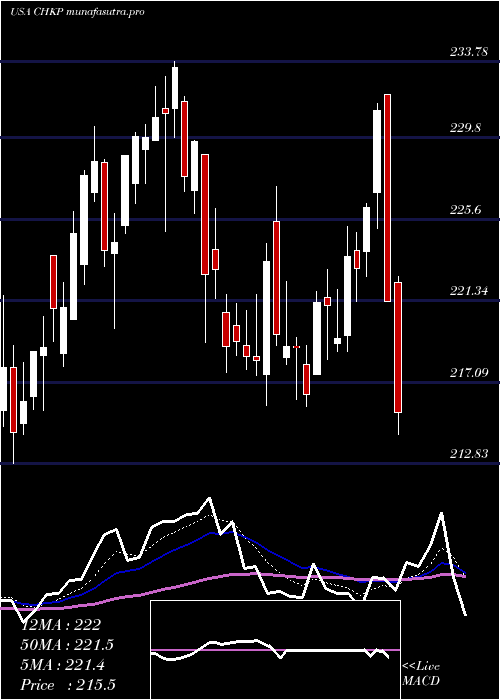
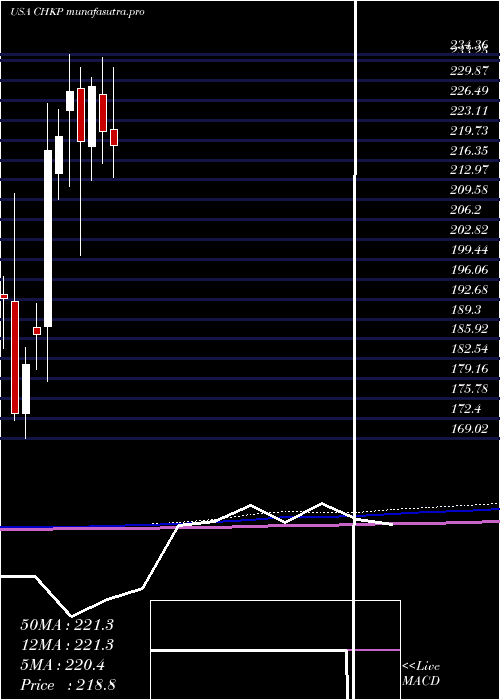
Monthly price and charts CheckPoint Strong monthly Stock price targets for CheckPoint CHKP are 179.73 and 200.71 | Monthly Target 1 | 175.26 | | Monthly Target 2 | 184.2 | | Monthly Target 3 | 196.23666666667 | | Monthly Target 4 | 205.18 | | Monthly Target 5 | 217.22 |
Monthly price and volumes Check Point
| Date |
Closing |
Open |
Range |
Volume |
Mon 20 October 2025 |
193.15 (-6.65%) |
207.00 |
187.29 - 208.27 |
0.6055 times |
Tue 30 September 2025 |
206.91 (7.13%) |
190.01 |
188.53 - 208.28 |
0.9022 times |
Fri 29 August 2025 |
193.14 (3.73%) |
186.33 |
178.68 - 195.00 |
1.0884 times |
Thu 31 July 2025 |
186.20 (-15.84%) |
221.52 |
183.10 - 232.07 |
1.2126 times |
Mon 30 June 2025 |
221.25 (-3.33%) |
227.45 |
215.83 - 233.78 |
0.7306 times |
Fri 30 May 2025 |
228.88 (4.24%) |
218.68 |
212.83 - 230.40 |
0.902 times |
Wed 30 April 2025 |
219.56 (-3.67%) |
228.51 |
200.05 - 232.00 |
1.2496 times |
Mon 31 March 2025 |
227.92 (3.48%) |
224.76 |
211.83 - 234.36 |
1.1718 times |
Fri 28 February 2025 |
220.26 (1.03%) |
214.11 |
209.65 - 224.99 |
1.0909 times |
Fri 31 January 2025 |
218.02 (16.78%) |
188.10 |
178.64 - 226.03 |
1.0465 times |
Tue 31 December 2024 |
186.70 (2.86%) |
187.80 |
180.75 - 191.99 |
0.5144 times |
DMA SMA EMA moving averages of Check Point CHKP
DMA (daily moving average) of Check Point CHKP
| DMA period | DMA value | | 5 day DMA | 191.3 | | 12 day DMA | 195.74 | | 20 day DMA | 199.18 | | 35 day DMA | 197.63 | | 50 day DMA | 194.98 | | 100 day DMA | 205.84 | | 150 day DMA | 210.49 | | 200 day DMA | 209.56 | EMA (exponential moving average) of Check Point CHKP
| EMA period | EMA current | EMA prev | EMA prev2 | | 5 day EMA | 192.23 | 191.77 | 192.33 | | 12 day EMA | 194.85 | 195.16 | 195.98 | | 20 day EMA | 196.14 | 196.45 | 197.06 | | 35 day EMA | 195.52 | 195.66 | 195.95 | | 50 day EMA | 193.81 | 193.84 | 193.97 |
SMA (simple moving average) of Check Point CHKP
| SMA period | SMA current | SMA prev | SMA prev2 | | 5 day SMA | 191.3 | 191.64 | 192.62 | | 12 day SMA | 195.74 | 196.75 | 197.87 | | 20 day SMA | 199.18 | 199.58 | 199.94 | | 35 day SMA | 197.63 | 197.63 | 197.7 | | 50 day SMA | 194.98 | 194.73 | 194.58 | | 100 day SMA | 205.84 | 206.2 | 206.57 | | 150 day SMA | 210.49 | 210.63 | 210.81 | | 200 day SMA | 209.56 | 209.52 | 209.51 |
|
|
