CheggInc CHGG full analysis,charts,indicators,moving averages,SMA,DMA,EMA,ADX,MACD,RSIChegg Inc CHGG WideScreen charts, DMA,SMA,EMA technical analysis, forecast prediction, by indicators ADX,MACD,RSI,CCI USA stock exchange
operates under Consumer Services sector & deals in Other Consumer Services
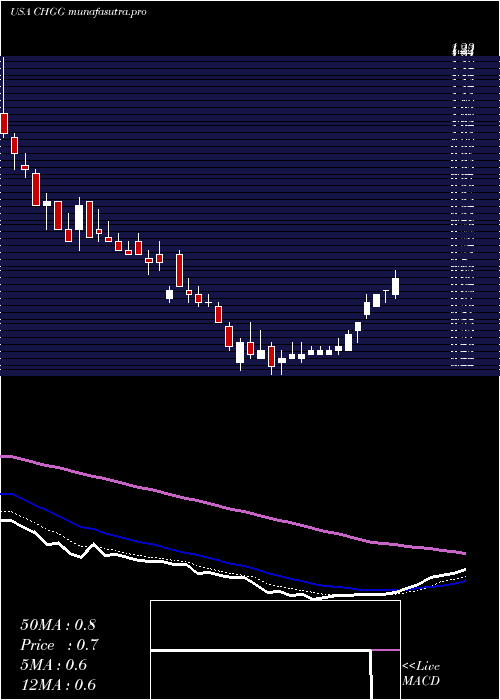
Daily price and charts and targets CheggInc Strong Daily Stock price targets for CheggInc CHGG are 0.88 and 0.97 | Daily Target 1 | 0.81 | | Daily Target 2 | 0.86 | | Daily Target 3 | 0.9 | | Daily Target 4 | 0.95 | | Daily Target 5 | 0.99 |
Daily price and volume Chegg Inc
| Date |
Closing |
Open |
Range |
Volume |
Fri 05 December 2025 |
0.91 (1.11%) |
0.90 |
0.85 - 0.94 |
1.0197 times |
Thu 04 December 2025 |
0.90 (-1.1%) |
0.90 |
0.89 - 0.93 |
0.4808 times |
Wed 03 December 2025 |
0.91 (-3.19%) |
0.95 |
0.90 - 0.95 |
0.5751 times |
Tue 02 December 2025 |
0.94 (8.05%) |
0.90 |
0.89 - 0.96 |
1.1891 times |
Mon 01 December 2025 |
0.87 (-10.31%) |
0.90 |
0.87 - 0.96 |
1.6118 times |
Fri 28 November 2025 |
0.97 (0%) |
0.98 |
0.93 - 1.00 |
0.967 times |
Wed 26 November 2025 |
0.97 (7.78%) |
0.92 |
0.90 - 1.01 |
1.3278 times |
Tue 25 November 2025 |
0.90 (-5.26%) |
0.93 |
0.87 - 0.96 |
0.9223 times |
Mon 24 November 2025 |
0.95 (0%) |
0.94 |
0.89 - 0.95 |
1.2513 times |
Fri 21 November 2025 |
0.95 (4.4%) |
0.91 |
0.91 - 0.97 |
0.6552 times |
Thu 20 November 2025 |
0.91 (-8.08%) |
1.01 |
0.89 - 1.04 |
1.3244 times |
Weekly price and charts CheggInc Strong weekly Stock price targets for CheggInc CHGG are 0.88 and 0.99 | Weekly Target 1 | 0.8 | | Weekly Target 2 | 0.85 | | Weekly Target 3 | 0.90666666666667 | | Weekly Target 4 | 0.96 | | Weekly Target 5 | 1.02 |
Weekly price and volumes for Chegg Inc
| Date |
Closing |
Open |
Range |
Volume |
Fri 05 December 2025 |
0.91 (-6.19%) |
0.90 |
0.85 - 0.96 |
0.6746 times |
Fri 28 November 2025 |
0.97 (2.11%) |
0.94 |
0.87 - 1.01 |
0.6181 times |
Fri 21 November 2025 |
0.95 (-12.84%) |
1.07 |
0.89 - 1.10 |
0.7057 times |
Fri 14 November 2025 |
1.09 (21.11%) |
0.97 |
0.88 - 1.23 |
1.4201 times |
Fri 07 November 2025 |
0.90 (-15.09%) |
0.94 |
0.87 - 1.05 |
0.8436 times |
Fri 31 October 2025 |
1.06 (0%) |
0.98 |
0.95 - 1.06 |
0.2593 times |
Fri 31 October 2025 |
1.06 (-23.74%) |
1.41 |
0.93 - 1.49 |
2.2198 times |
Fri 24 October 2025 |
1.39 (6.92%) |
1.30 |
1.28 - 1.42 |
0.599 times |
Fri 17 October 2025 |
1.30 (1.56%) |
1.34 |
1.17 - 1.37 |
1.133 times |
Fri 10 October 2025 |
1.28 (-17.95%) |
1.58 |
1.27 - 1.61 |
1.5267 times |
Fri 03 October 2025 |
1.56 (4%) |
1.50 |
1.46 - 1.68 |
0.9401 times |
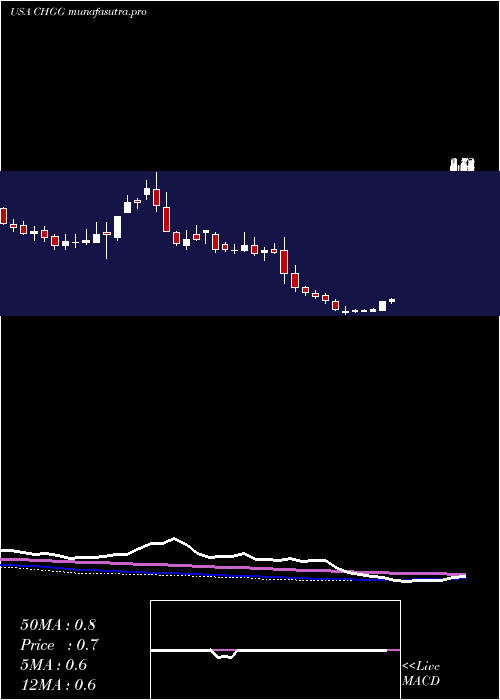
Monthly price and charts CheggInc Strong monthly Stock price targets for CheggInc CHGG are 0.88 and 0.99 | Monthly Target 1 | 0.8 | | Monthly Target 2 | 0.85 | | Monthly Target 3 | 0.90666666666667 | | Monthly Target 4 | 0.96 | | Monthly Target 5 | 1.02 |
Monthly price and volumes Chegg Inc
| Date |
Closing |
Open |
Range |
Volume |
Fri 05 December 2025 |
0.91 (-6.19%) |
0.90 |
0.85 - 0.96 |
0.1345 times |
Fri 28 November 2025 |
0.97 (-8.49%) |
0.94 |
0.87 - 1.23 |
0.7154 times |
Fri 31 October 2025 |
1.06 (-29.8%) |
1.54 |
0.93 - 1.68 |
1.2482 times |
Tue 30 September 2025 |
1.51 (2.72%) |
1.41 |
1.31 - 1.90 |
1.7245 times |
Fri 29 August 2025 |
1.47 (12.21%) |
1.26 |
1.00 - 1.47 |
0.8357 times |
Thu 31 July 2025 |
1.31 (8.26%) |
1.24 |
1.20 - 1.77 |
0.9187 times |
Mon 30 June 2025 |
1.21 (18.63%) |
1.04 |
1.02 - 1.89 |
1.7788 times |
Fri 30 May 2025 |
1.02 (39.73%) |
0.72 |
0.66 - 1.09 |
0.9998 times |
Wed 30 April 2025 |
0.73 (14.06%) |
0.64 |
0.44 - 0.73 |
0.6927 times |
Mon 31 March 2025 |
0.64 (-41.28%) |
1.09 |
0.62 - 1.23 |
0.9516 times |
Fri 28 February 2025 |
1.09 (-29.22%) |
1.55 |
0.94 - 1.68 |
1.1766 times |

DMA SMA EMA moving averages of Chegg Inc CHGG
DMA (daily moving average) of Chegg Inc CHGG
| DMA period | DMA value | | 5 day DMA | 0.91 | | 12 day DMA | 0.93 | | 20 day DMA | 0.98 | | 35 day DMA | 1.07 | | 50 day DMA | 1.18 | | 100 day DMA | 1.29 | | 150 day DMA | 1.25 | | 200 day DMA | 1.13 | EMA (exponential moving average) of Chegg Inc CHGG
| EMA period | EMA current | EMA prev | EMA prev2 | | 5 day EMA | 0.91 | 0.91 | 0.92 | | 12 day EMA | 0.94 | 0.95 | 0.96 | | 20 day EMA | 0.98 | 0.99 | 1 | | 35 day EMA | 1.09 | 1.1 | 1.11 | | 50 day EMA | 1.2 | 1.21 | 1.22 |
SMA (simple moving average) of Chegg Inc CHGG
| SMA period | SMA current | SMA prev | SMA prev2 | | 5 day SMA | 0.91 | 0.92 | 0.93 | | 12 day SMA | 0.93 | 0.94 | 0.95 | | 20 day SMA | 0.98 | 0.99 | 0.99 | | 35 day SMA | 1.07 | 1.08 | 1.09 | | 50 day SMA | 1.18 | 1.19 | 1.2 | | 100 day SMA | 1.29 | 1.3 | 1.3 | | 150 day SMA | 1.25 | 1.25 | 1.25 | | 200 day SMA | 1.13 | 1.13 | 1.13 |
|
|
