ChemedCorp CHE full analysis,charts,indicators,moving averages,SMA,DMA,EMA,ADX,MACD,RSIChemed Corp CHE WideScreen charts, DMA,SMA,EMA technical analysis, forecast prediction, by indicators ADX,MACD,RSI,CCI USA stock exchange
operates under Health Care sector & deals in Medical Nursing Services
Daily price and charts and targets ChemedCorp Strong Daily Stock price targets for ChemedCorp CHE are 440.78 and 449.96 | Daily Target 1 | 433.26 | | Daily Target 2 | 439.11 | | Daily Target 3 | 442.44333333333 | | Daily Target 4 | 448.29 | | Daily Target 5 | 451.62 |
Daily price and volume Chemed Corp
| Date |
Closing |
Open |
Range |
Volume |
Mon 20 October 2025 |
444.95 (1%) |
441.97 |
436.60 - 445.78 |
0.9372 times |
Fri 17 October 2025 |
440.56 (2.24%) |
435.59 |
431.84 - 440.77 |
0.8866 times |
Thu 16 October 2025 |
430.92 (-1.23%) |
434.11 |
429.77 - 437.48 |
1.592 times |
Wed 15 October 2025 |
436.29 (-0.19%) |
435.16 |
432.29 - 439.62 |
0.7397 times |
Tue 14 October 2025 |
437.13 (1.74%) |
429.07 |
429.07 - 437.80 |
0.8053 times |
Mon 13 October 2025 |
429.66 (-0.08%) |
426.74 |
426.67 - 431.41 |
0.8132 times |
Fri 10 October 2025 |
430.02 (-0.32%) |
432.17 |
426.84 - 432.17 |
1.0902 times |
Thu 09 October 2025 |
431.41 (-0.82%) |
434.39 |
427.84 - 437.00 |
1.0866 times |
Wed 08 October 2025 |
434.96 (-0.26%) |
437.49 |
433.30 - 439.71 |
1.0204 times |
Tue 07 October 2025 |
436.08 (0.16%) |
436.74 |
431.08 - 440.15 |
1.0288 times |
Mon 06 October 2025 |
435.38 (-1.83%) |
443.50 |
432.55 - 445.90 |
0.6118 times |
Weekly price and charts ChemedCorp Strong weekly Stock price targets for ChemedCorp CHE are 440.78 and 449.96 | Weekly Target 1 | 433.26 | | Weekly Target 2 | 439.11 | | Weekly Target 3 | 442.44333333333 | | Weekly Target 4 | 448.29 | | Weekly Target 5 | 451.62 |
Weekly price and volumes for Chemed Corp
| Date |
Closing |
Open |
Range |
Volume |
Mon 20 October 2025 |
444.95 (1%) |
441.97 |
436.60 - 445.78 |
0.2057 times |
Fri 17 October 2025 |
440.56 (2.45%) |
426.74 |
426.67 - 440.77 |
1.0615 times |
Fri 10 October 2025 |
430.02 (-3.04%) |
443.50 |
426.84 - 445.90 |
1.0617 times |
Fri 03 October 2025 |
443.49 (-4.05%) |
460.91 |
434.02 - 460.91 |
1.3685 times |
Fri 26 September 2025 |
462.23 (2.21%) |
451.96 |
445.87 - 462.94 |
0.9822 times |
Fri 19 September 2025 |
452.25 (1.31%) |
447.99 |
439.54 - 462.99 |
1.6344 times |
Fri 12 September 2025 |
446.40 (-4.13%) |
464.84 |
445.48 - 470.67 |
1.2227 times |
Fri 05 September 2025 |
465.63 (1.68%) |
470.49 |
455.81 - 474.89 |
1.1283 times |
Fri 29 August 2025 |
457.95 (0%) |
454.50 |
454.50 - 459.96 |
0.204 times |
Fri 29 August 2025 |
457.95 (-0.24%) |
459.23 |
443.44 - 461.02 |
1.1311 times |
Fri 22 August 2025 |
459.05 (3.13%) |
445.97 |
443.92 - 465.14 |
0.933 times |

Monthly price and charts ChemedCorp Strong monthly Stock price targets for ChemedCorp CHE are 424.45 and 447.17 | Monthly Target 1 | 417.62 | | Monthly Target 2 | 431.28 | | Monthly Target 3 | 440.33666666667 | | Monthly Target 4 | 454 | | Monthly Target 5 | 463.06 |
Monthly price and volumes Chemed Corp
| Date |
Closing |
Open |
Range |
Volume |
Mon 20 October 2025 |
444.95 (-0.62%) |
446.50 |
426.67 - 449.39 |
0.8049 times |
Tue 30 September 2025 |
447.74 (-2.23%) |
470.49 |
439.54 - 474.89 |
1.4471 times |
Fri 29 August 2025 |
457.95 (11.07%) |
415.65 |
408.42 - 465.14 |
1.2186 times |
Thu 31 July 2025 |
412.30 (-15.33%) |
485.00 |
410.00 - 487.98 |
1.3213 times |
Mon 30 June 2025 |
486.93 (-15.29%) |
570.98 |
473.55 - 572.23 |
1.1368 times |
Fri 30 May 2025 |
574.84 (-1.15%) |
575.21 |
550.47 - 583.96 |
0.9024 times |
Wed 30 April 2025 |
581.51 (-5.49%) |
617.00 |
537.23 - 623.61 |
0.983 times |
Mon 31 March 2025 |
615.32 (2.42%) |
599.61 |
585.66 - 620.00 |
0.8392 times |
Fri 28 February 2025 |
600.80 (6.9%) |
557.53 |
537.62 - 603.43 |
0.634 times |
Fri 31 January 2025 |
562.00 (6.08%) |
533.27 |
520.16 - 577.30 |
0.7127 times |
Tue 31 December 2024 |
529.80 (-7.61%) |
567.28 |
512.12 - 567.28 |
0.6065 times |

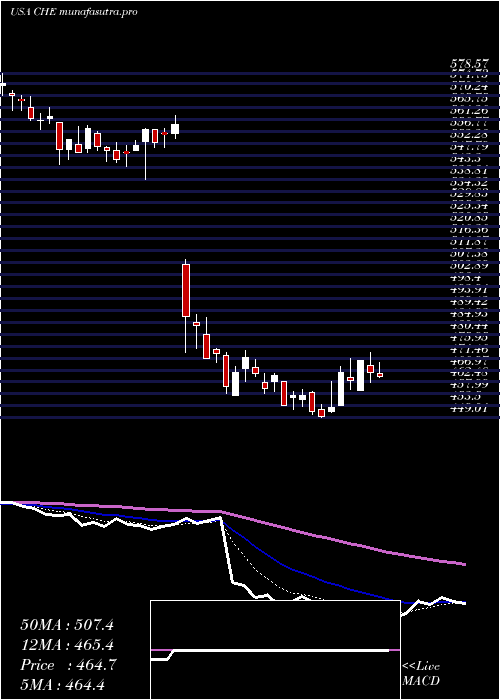
DMA SMA EMA moving averages of Chemed Corp CHE
DMA (daily moving average) of Chemed Corp CHE
| DMA period | DMA value | | 5 day DMA | 437.97 | | 12 day DMA | 435.9 | | 20 day DMA | 441.85 | | 35 day DMA | 448.03 | | 50 day DMA | 449.13 | | 100 day DMA | 473.47 | | 150 day DMA | 509.94 | | 200 day DMA | 522.77 | EMA (exponential moving average) of Chemed Corp CHE
| EMA period | EMA current | EMA prev | EMA prev2 | | 5 day EMA | 438.9 | 435.87 | 433.53 | | 12 day EMA | 438.59 | 437.43 | 436.86 | | 20 day EMA | 440.78 | 440.34 | 440.32 | | 35 day EMA | 443.37 | 443.28 | 443.44 | | 50 day EMA | 446.64 | 446.71 | 446.96 |
SMA (simple moving average) of Chemed Corp CHE
| SMA period | SMA current | SMA prev | SMA prev2 | | 5 day SMA | 437.97 | 434.91 | 432.8 | | 12 day SMA | 435.9 | 435.66 | 435.67 | | 20 day SMA | 441.85 | 442.4 | 442.98 | | 35 day SMA | 448.03 | 448.4 | 448.9 | | 50 day SMA | 449.13 | 448.87 | 448.77 | | 100 day SMA | 473.47 | 474.83 | 476.12 | | 150 day SMA | 509.94 | 511.03 | 512.08 | | 200 day SMA | 522.77 | 523.22 | 523.66 |
|
|
