ChurchillDowns CHDN full analysis,charts,indicators,moving averages,SMA,DMA,EMA,ADX,MACD,RSIChurchill Downs CHDN WideScreen charts, DMA,SMA,EMA technical analysis, forecast prediction, by indicators ADX,MACD,RSI,CCI USA stock exchange
operates under Consumer Services sector & deals in Services Misc Amusement Recreation
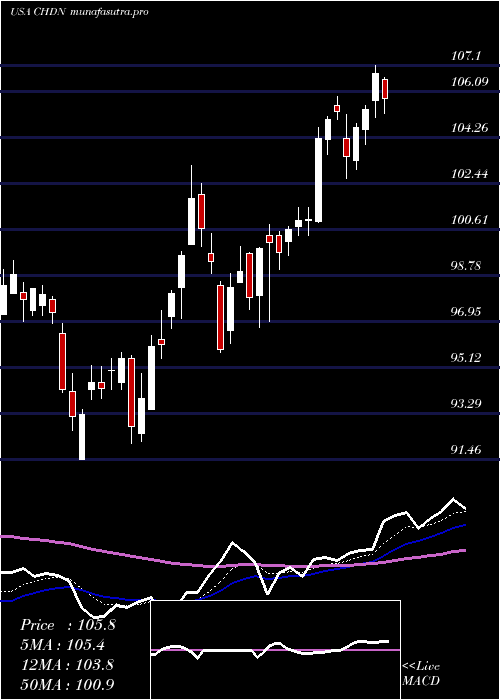
Daily price and charts and targets ChurchillDowns Strong Daily Stock price targets for ChurchillDowns CHDN are 112.01 and 114.63 | Daily Target 1 | 109.84 | | Daily Target 2 | 111.55 | | Daily Target 3 | 112.45666666667 | | Daily Target 4 | 114.17 | | Daily Target 5 | 115.08 |
Daily price and volume Churchill Downs
| Date |
Closing |
Open |
Range |
Volume |
Thu 04 December 2025 |
113.27 (1.48%) |
111.70 |
110.74 - 113.36 |
1.0491 times |
Wed 03 December 2025 |
111.62 (0.57%) |
111.50 |
111.04 - 113.00 |
1.0859 times |
Tue 02 December 2025 |
110.99 (0.14%) |
110.95 |
109.29 - 111.71 |
1.4165 times |
Mon 01 December 2025 |
110.83 (1.6%) |
108.89 |
108.35 - 111.30 |
1.0641 times |
Fri 28 November 2025 |
109.09 (0.7%) |
109.13 |
108.03 - 109.79 |
0.5122 times |
Wed 26 November 2025 |
108.33 (0.59%) |
107.61 |
107.52 - 110.60 |
1.0743 times |
Tue 25 November 2025 |
107.69 (1.41%) |
106.48 |
106.43 - 108.20 |
0.8437 times |
Mon 24 November 2025 |
106.19 (0%) |
105.99 |
104.47 - 106.25 |
0.7024 times |
Fri 21 November 2025 |
106.19 (1.72%) |
104.77 |
103.61 - 107.72 |
0.7591 times |
Thu 20 November 2025 |
104.39 (1.63%) |
103.01 |
100.90 - 104.71 |
1.4927 times |
Wed 19 November 2025 |
102.72 (-1.76%) |
104.47 |
102.56 - 104.71 |
0.8601 times |
Weekly price and charts ChurchillDowns Strong weekly Stock price targets for ChurchillDowns CHDN are 110.81 and 115.82 | Weekly Target 1 | 106.65 | | Weekly Target 2 | 109.96 | | Weekly Target 3 | 111.66 | | Weekly Target 4 | 114.97 | | Weekly Target 5 | 116.67 |
Weekly price and volumes for Churchill Downs
| Date |
Closing |
Open |
Range |
Volume |
Thu 04 December 2025 |
113.27 (3.83%) |
108.89 |
108.35 - 113.36 |
1.1093 times |
Fri 28 November 2025 |
109.09 (2.73%) |
105.99 |
104.47 - 110.60 |
0.7529 times |
Fri 21 November 2025 |
106.19 (6.95%) |
99.10 |
98.05 - 107.72 |
1.2124 times |
Fri 14 November 2025 |
99.29 (1.91%) |
97.75 |
97.44 - 101.74 |
0.7289 times |
Fri 07 November 2025 |
97.43 (-1.78%) |
98.12 |
92.76 - 100.83 |
0.6664 times |
Fri 31 October 2025 |
99.20 (0%) |
99.79 |
98.47 - 100.33 |
0.227 times |
Fri 31 October 2025 |
99.20 (-1.78%) |
101.44 |
98.14 - 103.46 |
1.3239 times |
Fri 24 October 2025 |
101.00 (11.57%) |
90.84 |
90.71 - 108.08 |
2.0121 times |
Fri 17 October 2025 |
90.53 (0.57%) |
90.59 |
86.11 - 91.05 |
1.1126 times |
Fri 10 October 2025 |
90.02 (-6.21%) |
96.14 |
88.95 - 96.14 |
0.8545 times |
Fri 03 October 2025 |
95.98 (-0.99%) |
97.25 |
95.47 - 98.41 |
0.7279 times |
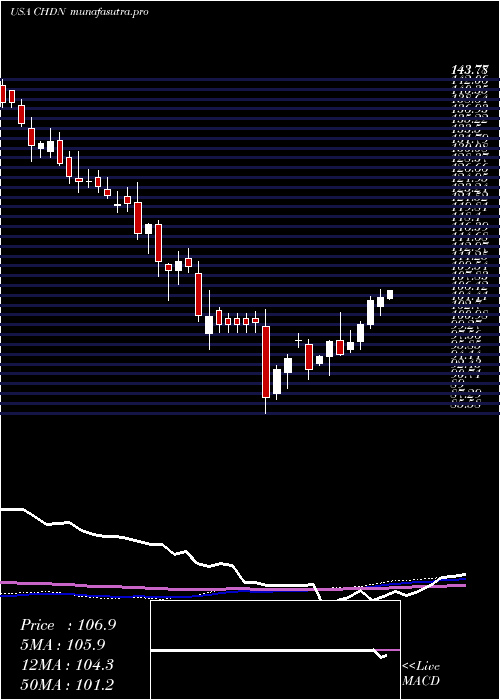
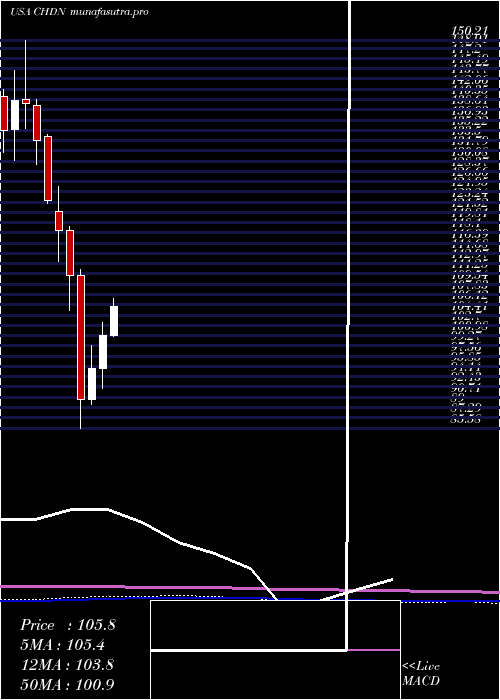
Monthly price and charts ChurchillDowns Strong monthly Stock price targets for ChurchillDowns CHDN are 110.81 and 115.82 | Monthly Target 1 | 106.65 | | Monthly Target 2 | 109.96 | | Monthly Target 3 | 111.66 | | Monthly Target 4 | 114.97 | | Monthly Target 5 | 116.67 |
Monthly price and volumes Churchill Downs
| Date |
Closing |
Open |
Range |
Volume |
Thu 04 December 2025 |
113.27 (3.83%) |
108.89 |
108.35 - 113.36 |
0.2601 times |
Fri 28 November 2025 |
109.09 (9.97%) |
98.12 |
92.76 - 110.60 |
0.7879 times |
Fri 31 October 2025 |
99.20 (2.26%) |
96.36 |
86.11 - 108.08 |
1.3873 times |
Tue 30 September 2025 |
97.01 (-6.48%) |
103.08 |
93.04 - 103.54 |
0.9108 times |
Fri 29 August 2025 |
103.73 (-3.09%) |
105.79 |
99.77 - 107.03 |
0.7613 times |
Thu 31 July 2025 |
107.04 (5.98%) |
100.93 |
100.90 - 118.46 |
1.0617 times |
Mon 30 June 2025 |
101.00 (5.79%) |
95.47 |
92.12 - 103.13 |
1.0654 times |
Fri 30 May 2025 |
95.47 (5.6%) |
90.33 |
89.43 - 99.38 |
1.3519 times |
Wed 30 April 2025 |
90.41 (-18.6%) |
110.94 |
85.58 - 112.03 |
1.5625 times |
Mon 31 March 2025 |
111.07 (-6.27%) |
118.55 |
105.18 - 119.11 |
0.8509 times |
Fri 28 February 2025 |
118.50 (-4.11%) |
121.72 |
113.40 - 125.87 |
0.9198 times |
DMA SMA EMA moving averages of Churchill Downs CHDN
DMA (daily moving average) of Churchill Downs CHDN
| DMA period | DMA value | | 5 day DMA | 111.16 | | 12 day DMA | 107.99 | | 20 day DMA | 104.39 | | 35 day DMA | 101.67 | | 50 day DMA | 99.15 | | 100 day DMA | 100.98 | | 150 day DMA | 100.11 | | 200 day DMA | 101.8 | EMA (exponential moving average) of Churchill Downs CHDN
| EMA period | EMA current | EMA prev | EMA prev2 | | 5 day EMA | 111.16 | 110.11 | 109.35 | | 12 day EMA | 108.24 | 107.33 | 106.55 | | 20 day EMA | 105.89 | 105.11 | 104.42 | | 35 day EMA | 102.76 | 102.14 | 101.58 | | 50 day EMA | 100.14 | 99.6 | 99.11 |
SMA (simple moving average) of Churchill Downs CHDN
| SMA period | SMA current | SMA prev | SMA prev2 | | 5 day SMA | 111.16 | 110.17 | 109.39 | | 12 day SMA | 107.99 | 106.87 | 105.84 | | 20 day SMA | 104.39 | 103.67 | 103.04 | | 35 day SMA | 101.67 | 100.91 | 100.25 | | 50 day SMA | 99.15 | 98.84 | 98.54 | | 100 day SMA | 100.98 | 100.89 | 100.85 | | 150 day SMA | 100.11 | 99.96 | 99.82 | | 200 day SMA | 101.8 | 101.85 | 101.9 |
|
|
