ChurchDwight CHD full analysis,charts,indicators,moving averages,SMA,DMA,EMA,ADX,MACD,RSIChurch Dwight CHD WideScreen charts, DMA,SMA,EMA technical analysis, forecast prediction, by indicators ADX,MACD,RSI,CCI USA stock exchange
operates under Basic Industries sector & deals in Package Goods Cosmetics
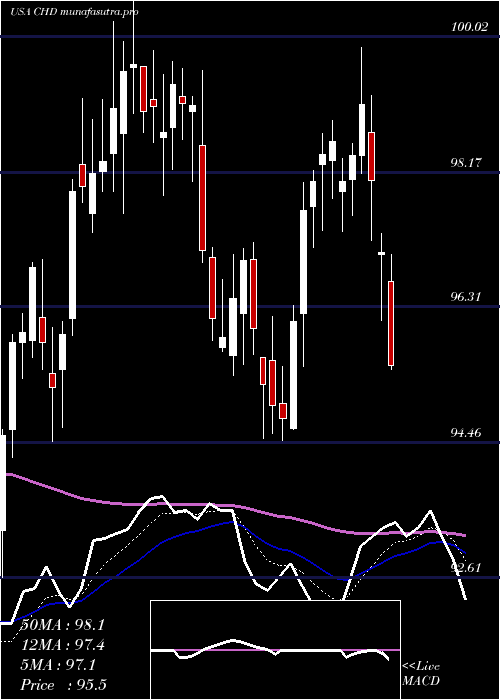
Daily price and charts and targets ChurchDwight Strong Daily Stock price targets for ChurchDwight CHD are 86.85 and 88.34 | Daily Target 1 | 86.43 | | Daily Target 2 | 87.26 | | Daily Target 3 | 87.923333333333 | | Daily Target 4 | 88.75 | | Daily Target 5 | 89.41 |
Daily price and volume Church Dwight
| Date |
Closing |
Open |
Range |
Volume |
Mon 20 October 2025 |
88.08 (-0.45%) |
88.45 |
87.10 - 88.59 |
1.0719 times |
Fri 17 October 2025 |
88.48 (1.41%) |
87.87 |
87.28 - 88.59 |
0.8642 times |
Thu 16 October 2025 |
87.25 (1.01%) |
86.50 |
86.31 - 87.73 |
1.3788 times |
Wed 15 October 2025 |
86.38 (-0.63%) |
86.31 |
86.14 - 86.88 |
0.8682 times |
Tue 14 October 2025 |
86.93 (0.47%) |
86.99 |
86.14 - 87.18 |
0.7544 times |
Mon 13 October 2025 |
86.52 (-1.35%) |
86.66 |
86.08 - 87.31 |
1.0948 times |
Fri 10 October 2025 |
87.70 (0.09%) |
87.85 |
87.30 - 88.80 |
1.1894 times |
Thu 09 October 2025 |
87.62 (-1.46%) |
88.60 |
87.53 - 88.74 |
0.6764 times |
Wed 08 October 2025 |
88.92 (-1.21%) |
89.81 |
88.70 - 90.64 |
0.873 times |
Tue 07 October 2025 |
90.01 (1.26%) |
88.90 |
88.23 - 90.52 |
1.2288 times |
Mon 06 October 2025 |
88.89 (1.13%) |
87.50 |
87.50 - 89.16 |
0.8943 times |
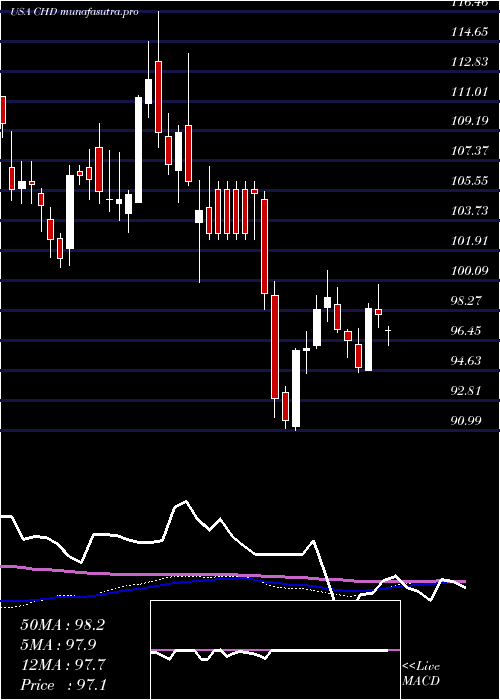
Weekly price and charts ChurchDwight Strong weekly Stock price targets for ChurchDwight CHD are 86.85 and 88.34 | Weekly Target 1 | 86.43 | | Weekly Target 2 | 87.26 | | Weekly Target 3 | 87.923333333333 | | Weekly Target 4 | 88.75 | | Weekly Target 5 | 89.41 |
Weekly price and volumes for Church Dwight
| Date |
Closing |
Open |
Range |
Volume |
Mon 20 October 2025 |
88.08 (-0.45%) |
88.45 |
87.10 - 88.59 |
0.2468 times |
Fri 17 October 2025 |
88.48 (0.89%) |
86.66 |
86.08 - 88.59 |
1.142 times |
Fri 10 October 2025 |
87.70 (-0.23%) |
87.50 |
87.30 - 90.64 |
1.1193 times |
Fri 03 October 2025 |
87.90 (1.38%) |
86.40 |
85.08 - 88.84 |
1.1695 times |
Fri 26 September 2025 |
86.70 (-4.04%) |
90.36 |
85.61 - 90.55 |
1.5101 times |
Fri 19 September 2025 |
90.35 (-2.79%) |
93.04 |
90.22 - 93.28 |
1.5233 times |
Fri 12 September 2025 |
92.94 (-2.99%) |
95.40 |
92.24 - 95.42 |
1.0089 times |
Fri 05 September 2025 |
95.80 (2.83%) |
93.46 |
92.00 - 96.53 |
0.9961 times |
Fri 29 August 2025 |
93.16 (0%) |
92.62 |
92.09 - 93.39 |
0.1691 times |
Fri 29 August 2025 |
93.16 (-1.96%) |
94.74 |
91.70 - 95.08 |
1.1149 times |
Fri 22 August 2025 |
95.02 (2.75%) |
92.62 |
92.38 - 95.98 |
1.2104 times |
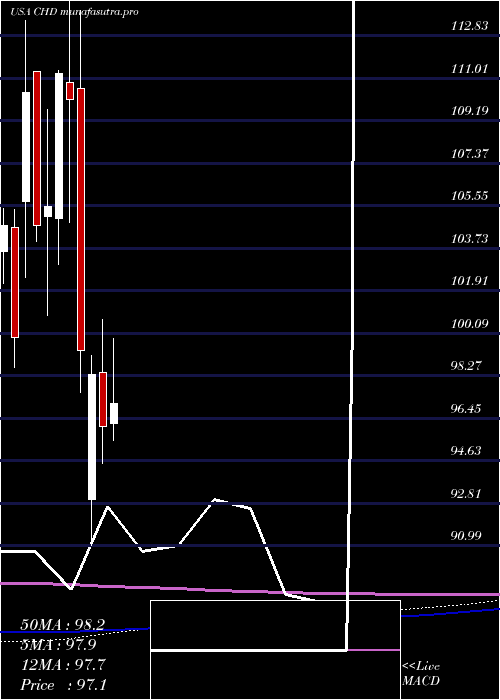
Monthly price and charts ChurchDwight Strong monthly Stock price targets for ChurchDwight CHD are 87.08 and 91.64 | Monthly Target 1 | 83.71 | | Monthly Target 2 | 85.89 | | Monthly Target 3 | 88.266666666667 | | Monthly Target 4 | 90.45 | | Monthly Target 5 | 92.83 |
Monthly price and volumes Church Dwight
| Date |
Closing |
Open |
Range |
Volume |
Mon 20 October 2025 |
88.08 (0.51%) |
87.72 |
86.08 - 90.64 |
0.6104 times |
Tue 30 September 2025 |
87.63 (-5.94%) |
93.46 |
85.08 - 96.53 |
1.1374 times |
Fri 29 August 2025 |
93.16 (-0.65%) |
93.00 |
90.50 - 95.98 |
1.0928 times |
Thu 31 July 2025 |
93.77 (-2.43%) |
96.23 |
93.31 - 99.86 |
1.1392 times |
Mon 30 June 2025 |
96.11 (-2.24%) |
98.42 |
94.49 - 100.69 |
1.1413 times |
Fri 30 May 2025 |
98.31 (-1.04%) |
92.99 |
90.99 - 99.16 |
1.3734 times |
Wed 30 April 2025 |
99.34 (-9.76%) |
110.59 |
97.54 - 113.91 |
1.0848 times |
Mon 31 March 2025 |
110.09 (-1%) |
110.84 |
104.84 - 116.46 |
0.7854 times |
Fri 28 February 2025 |
111.20 (5.38%) |
105.01 |
103.03 - 111.36 |
0.7355 times |
Fri 31 January 2025 |
105.52 (0.77%) |
105.08 |
100.86 - 109.67 |
0.8998 times |
Tue 31 December 2024 |
104.71 (-5.14%) |
111.29 |
104.01 - 111.29 |
0.5176 times |
DMA SMA EMA moving averages of Church Dwight CHD
DMA (daily moving average) of Church Dwight CHD
| DMA period | DMA value | | 5 day DMA | 87.42 | | 12 day DMA | 87.89 | | 20 day DMA | 87.57 | | 35 day DMA | 89.79 | | 50 day DMA | 90.84 | | 100 day DMA | 93.79 | | 150 day DMA | 96.11 | | 200 day DMA | 98.85 | EMA (exponential moving average) of Church Dwight CHD
| EMA period | EMA current | EMA prev | EMA prev2 | | 5 day EMA | 87.74 | 87.57 | 87.12 | | 12 day EMA | 87.81 | 87.76 | 87.63 | | 20 day EMA | 88.26 | 88.28 | 88.26 | | 35 day EMA | 89.29 | 89.36 | 89.41 | | 50 day EMA | 90.58 | 90.68 | 90.77 |
SMA (simple moving average) of Church Dwight CHD
| SMA period | SMA current | SMA prev | SMA prev2 | | 5 day SMA | 87.42 | 87.11 | 86.96 | | 12 day SMA | 87.89 | 87.92 | 87.87 | | 20 day SMA | 87.57 | 87.5 | 87.59 | | 35 day SMA | 89.79 | 89.94 | 90.07 | | 50 day SMA | 90.84 | 90.91 | 90.96 | | 100 day SMA | 93.79 | 93.88 | 93.96 | | 150 day SMA | 96.11 | 96.24 | 96.38 | | 200 day SMA | 98.85 | 98.91 | 98.99 |
|
|
