CityHolding CHCO full analysis,charts,indicators,moving averages,SMA,DMA,EMA,ADX,MACD,RSICity Holding CHCO WideScreen charts, DMA,SMA,EMA technical analysis, forecast prediction, by indicators ADX,MACD,RSI,CCI USA stock exchange
operates under Finance sector & deals in Major Banks
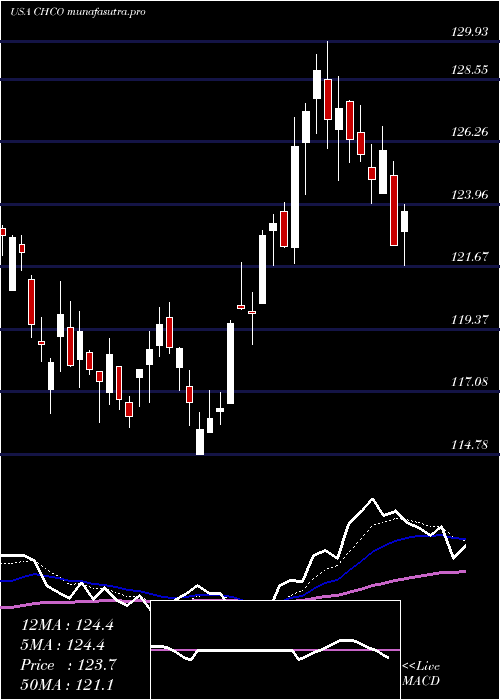
Daily price and charts and targets CityHolding Strong Daily Stock price targets for CityHolding CHCO are 122.16 and 123.75 | Daily Target 1 | 120.98 | | Daily Target 2 | 121.74 | | Daily Target 3 | 122.57333333333 | | Daily Target 4 | 123.33 | | Daily Target 5 | 124.16 |
Daily price and volume City Holding
| Date |
Closing |
Open |
Range |
Volume |
Thu 04 December 2025 |
122.49 (-0.24%) |
122.14 |
121.82 - 123.41 |
0.5911 times |
Wed 03 December 2025 |
122.78 (1.25%) |
120.68 |
120.54 - 123.75 |
1.1208 times |
Tue 02 December 2025 |
121.27 (-0.43%) |
122.42 |
121.25 - 122.49 |
0.773 times |
Mon 01 December 2025 |
121.79 (0.4%) |
120.78 |
120.05 - 121.97 |
0.8676 times |
Fri 28 November 2025 |
121.31 (-0.53%) |
122.12 |
120.80 - 122.12 |
0.5592 times |
Wed 26 November 2025 |
121.96 (-0.55%) |
122.36 |
121.92 - 124.00 |
1.7341 times |
Tue 25 November 2025 |
122.64 (1.63%) |
121.41 |
121.41 - 123.66 |
1.0213 times |
Mon 24 November 2025 |
120.67 (-1.18%) |
121.62 |
119.33 - 122.46 |
1.1921 times |
Fri 21 November 2025 |
122.11 (2.73%) |
119.11 |
119.04 - 123.02 |
1.2941 times |
Thu 20 November 2025 |
118.87 (-0.04%) |
120.07 |
118.87 - 121.13 |
0.8467 times |
Wed 19 November 2025 |
118.92 (0.53%) |
117.83 |
117.66 - 119.46 |
0.9463 times |
Weekly price and charts CityHolding Strong weekly Stock price targets for CityHolding CHCO are 121.27 and 124.97 | Weekly Target 1 | 118.4 | | Weekly Target 2 | 120.44 | | Weekly Target 3 | 122.09666666667 | | Weekly Target 4 | 124.14 | | Weekly Target 5 | 125.8 |
Weekly price and volumes for City Holding
| Date |
Closing |
Open |
Range |
Volume |
Thu 04 December 2025 |
122.49 (0.97%) |
120.78 |
120.05 - 123.75 |
0.7576 times |
Fri 28 November 2025 |
121.31 (-0.66%) |
121.62 |
119.33 - 124.00 |
1.0184 times |
Fri 21 November 2025 |
122.11 (1.26%) |
120.78 |
116.22 - 123.02 |
1.5278 times |
Fri 14 November 2025 |
120.59 (0.25%) |
120.79 |
119.08 - 123.67 |
1.3267 times |
Fri 07 November 2025 |
120.29 (2.04%) |
118.71 |
117.36 - 120.79 |
0.9076 times |
Fri 31 October 2025 |
117.88 (0%) |
117.59 |
116.30 - 118.83 |
0.2222 times |
Fri 31 October 2025 |
117.88 (-3.26%) |
122.07 |
116.30 - 122.47 |
0.9943 times |
Fri 24 October 2025 |
121.85 (2.03%) |
119.75 |
119.46 - 124.87 |
0.957 times |
Fri 17 October 2025 |
119.42 (0.8%) |
119.66 |
116.00 - 123.73 |
1.1992 times |
Fri 10 October 2025 |
118.47 (-3.48%) |
123.63 |
118.39 - 124.85 |
1.0892 times |
Fri 03 October 2025 |
122.74 (-3%) |
126.25 |
121.30 - 126.80 |
1.0667 times |

Monthly price and charts CityHolding Strong monthly Stock price targets for CityHolding CHCO are 121.27 and 124.97 | Monthly Target 1 | 118.4 | | Monthly Target 2 | 120.44 | | Monthly Target 3 | 122.09666666667 | | Monthly Target 4 | 124.14 | | Monthly Target 5 | 125.8 |
Monthly price and volumes City Holding
| Date |
Closing |
Open |
Range |
Volume |
Thu 04 December 2025 |
122.49 (0.97%) |
120.78 |
120.05 - 123.75 |
0.1607 times |
Fri 28 November 2025 |
121.31 (2.91%) |
118.71 |
116.22 - 124.00 |
1.0141 times |
Fri 31 October 2025 |
117.88 (-4.84%) |
123.03 |
116.00 - 124.87 |
1.0652 times |
Tue 30 September 2025 |
123.87 (-3.59%) |
127.77 |
122.22 - 131.73 |
1.0909 times |
Fri 29 August 2025 |
128.48 (5.23%) |
121.54 |
118.14 - 131.07 |
1.0578 times |
Thu 31 July 2025 |
122.10 (-0.26%) |
122.38 |
120.49 - 133.59 |
2.0499 times |
Mon 30 June 2025 |
122.42 (3.84%) |
117.81 |
114.78 - 124.04 |
1.0292 times |
Fri 30 May 2025 |
117.89 (1.74%) |
116.02 |
114.70 - 125.58 |
0.6063 times |
Wed 30 April 2025 |
115.87 (-1.36%) |
116.56 |
102.22 - 119.25 |
1.0614 times |
Mon 31 March 2025 |
117.47 (-1.28%) |
118.84 |
113.23 - 120.68 |
0.8645 times |
Fri 28 February 2025 |
118.99 (0.73%) |
116.08 |
114.95 - 122.62 |
0.4963 times |

DMA SMA EMA moving averages of City Holding CHCO
DMA (daily moving average) of City Holding CHCO
| DMA period | DMA value | | 5 day DMA | 121.93 | | 12 day DMA | 121.09 | | 20 day DMA | 120.76 | | 35 day DMA | 120.35 | | 50 day DMA | 121 | | 100 day DMA | 123.25 | | 150 day DMA | 122.35 | | 200 day DMA | 120.65 | EMA (exponential moving average) of City Holding CHCO
| EMA period | EMA current | EMA prev | EMA prev2 | | 5 day EMA | 122.08 | 121.87 | 121.42 | | 12 day EMA | 121.43 | 121.24 | 120.96 | | 20 day EMA | 121.09 | 120.94 | 120.75 | | 35 day EMA | 121.22 | 121.15 | 121.05 | | 50 day EMA | 121.4 | 121.36 | 121.3 |
SMA (simple moving average) of City Holding CHCO
| SMA period | SMA current | SMA prev | SMA prev2 | | 5 day SMA | 121.93 | 121.82 | 121.79 | | 12 day SMA | 121.09 | 120.67 | 120.49 | | 20 day SMA | 120.76 | 120.64 | 120.45 | | 35 day SMA | 120.35 | 120.27 | 120.28 | | 50 day SMA | 121 | 121.01 | 121.04 | | 100 day SMA | 123.25 | 123.25 | 123.28 | | 150 day SMA | 122.35 | 122.31 | 122.27 | | 200 day SMA | 120.65 | 120.64 | 120.62 |
|
|
