ChinaTelecom CHA full analysis,charts,indicators,moving averages,SMA,DMA,EMA,ADX,MACD,RSIChina Telecom CHA WideScreen charts, DMA,SMA,EMA technical analysis, forecast prediction, by indicators ADX,MACD,RSI,CCI USA stock exchange
operates under Public Utilities sector & deals in Telecommunications Equipment
Daily price and charts and targets ChinaTelecom Strong Daily Stock price targets for ChinaTelecom CHA are 12.72 and 14.98 | Daily Target 1 | 12.09 | | Daily Target 2 | 13.34 | | Daily Target 3 | 14.346666666667 | | Daily Target 4 | 15.6 | | Daily Target 5 | 16.61 |
Daily price and volume China Telecom
| Date |
Closing |
Open |
Range |
Volume |
Thu 04 December 2025 |
14.60 (-4.45%) |
15.20 |
13.09 - 15.35 |
2.3777 times |
Wed 03 December 2025 |
15.28 (-5.91%) |
16.06 |
15.07 - 16.06 |
1.0278 times |
Tue 02 December 2025 |
16.24 (2.14%) |
16.00 |
15.25 - 16.56 |
0.9854 times |
Mon 01 December 2025 |
15.90 (6.07%) |
14.97 |
14.90 - 16.36 |
1.196 times |
Fri 28 November 2025 |
14.99 (6.61%) |
14.50 |
14.50 - 15.49 |
1.1313 times |
Wed 26 November 2025 |
14.06 (-0.99%) |
14.30 |
13.90 - 14.52 |
0.4729 times |
Tue 25 November 2025 |
14.20 (6.93%) |
13.21 |
13.11 - 14.27 |
0.7291 times |
Mon 24 November 2025 |
13.28 (-2.78%) |
13.71 |
13.24 - 13.75 |
0.442 times |
Fri 21 November 2025 |
13.66 (4.51%) |
13.07 |
13.07 - 13.76 |
0.5158 times |
Thu 20 November 2025 |
13.07 (-8.09%) |
14.22 |
13.04 - 14.34 |
1.122 times |
Wed 19 November 2025 |
14.22 (-2.6%) |
14.52 |
14.21 - 14.68 |
0.4098 times |
Weekly price and charts ChinaTelecom Strong weekly Stock price targets for ChinaTelecom CHA are 12.11 and 15.58 | Weekly Target 1 | 11.28 | | Weekly Target 2 | 12.94 | | Weekly Target 3 | 14.75 | | Weekly Target 4 | 16.41 | | Weekly Target 5 | 18.22 |
Weekly price and volumes for China Telecom
| Date |
Closing |
Open |
Range |
Volume |
Thu 04 December 2025 |
14.60 (-2.6%) |
14.97 |
13.09 - 16.56 |
1.5592 times |
Fri 28 November 2025 |
14.99 (9.74%) |
13.71 |
13.11 - 15.49 |
0.7745 times |
Fri 21 November 2025 |
13.66 (-7.2%) |
14.72 |
13.04 - 14.81 |
0.8305 times |
Fri 14 November 2025 |
14.72 (1.1%) |
15.20 |
14.57 - 15.93 |
1.1072 times |
Fri 07 November 2025 |
14.56 (-6.96%) |
15.00 |
14.24 - 15.48 |
0.7641 times |
Fri 31 October 2025 |
15.65 (0%) |
15.50 |
15.48 - 15.75 |
0.1268 times |
Fri 31 October 2025 |
15.65 (-9.75%) |
17.40 |
15.48 - 17.48 |
0.9177 times |
Fri 24 October 2025 |
17.34 (9.06%) |
15.96 |
15.94 - 17.66 |
1.2163 times |
Fri 17 October 2025 |
15.90 (0.25%) |
16.11 |
15.41 - 16.74 |
1.0727 times |
Fri 10 October 2025 |
15.86 (-6.43%) |
17.02 |
15.79 - 17.30 |
1.631 times |
Fri 03 October 2025 |
16.95 (0.47%) |
16.95 |
16.20 - 17.40 |
1.0296 times |
Monthly price and charts ChinaTelecom Strong monthly Stock price targets for ChinaTelecom CHA are 12.11 and 15.58 | Monthly Target 1 | 11.28 | | Monthly Target 2 | 12.94 | | Monthly Target 3 | 14.75 | | Monthly Target 4 | 16.41 | | Monthly Target 5 | 18.22 |
Monthly price and volumes China Telecom
| Date |
Closing |
Open |
Range |
Volume |
Thu 04 December 2025 |
14.60 (-2.6%) |
14.97 |
13.09 - 16.56 |
0.2754 times |
Fri 28 November 2025 |
14.99 (-4.22%) |
15.00 |
13.04 - 15.93 |
0.614 times |
Fri 31 October 2025 |
15.65 (-5.44%) |
16.55 |
15.41 - 17.66 |
0.9928 times |
Tue 30 September 2025 |
16.55 (-13.4%) |
19.00 |
16.17 - 19.00 |
1.206 times |
Fri 29 August 2025 |
19.11 (-13.57%) |
21.91 |
19.00 - 23.90 |
1.575 times |
Thu 31 July 2025 |
22.11 (-15.32%) |
26.42 |
22.06 - 29.10 |
1.2474 times |
Mon 30 June 2025 |
26.11 (-6.78%) |
28.86 |
25.26 - 35.42 |
1.324 times |
Fri 30 May 2025 |
28.01 (-16.36%) |
33.60 |
27.21 - 36.46 |
1.2945 times |
Wed 30 April 2025 |
33.49 (26.62%) |
33.75 |
29.00 - 41.80 |
1.1523 times |
Fri 08 January 2021 |
26.45 (-3.99%) |
26.00 |
24.10 - 32.98 |
0.3185 times |
Thu 31 December 2020 |
27.55 (-8.5%) |
30.37 |
27.35 - 30.66 |
0.1867 times |

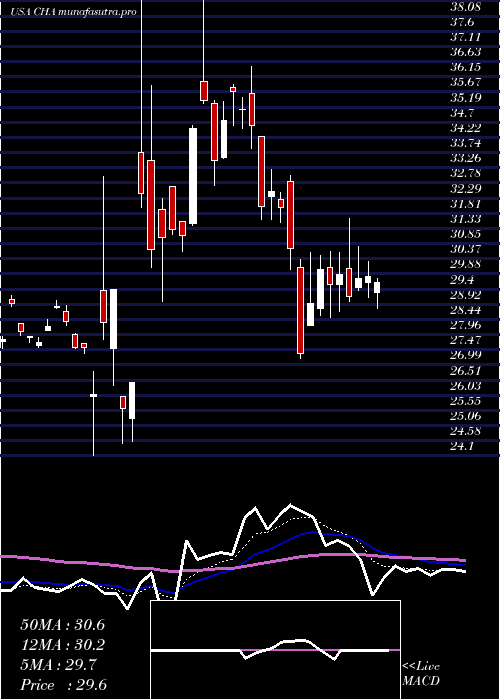
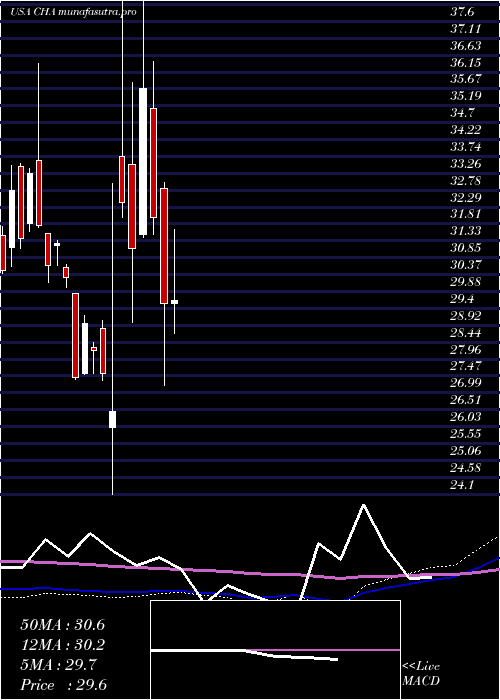
DMA SMA EMA moving averages of China Telecom CHA
DMA (daily moving average) of China Telecom CHA
| DMA period | DMA value | | 5 day DMA | 15.4 | | 12 day DMA | 14.51 | | 20 day DMA | 14.61 | | 35 day DMA | 15.34 | | 50 day DMA | 15.7 | | 100 day DMA | 18.3 | | 150 day DMA | 22.1 | | 200 day DMA | 24.09 | EMA (exponential moving average) of China Telecom CHA
| EMA period | EMA current | EMA prev | EMA prev2 | | 5 day EMA | 15.06 | 15.29 | 15.29 | | 12 day EMA | 14.86 | 14.91 | 14.84 | | 20 day EMA | 14.92 | 14.95 | 14.92 | | 35 day EMA | 15.27 | 15.31 | 15.31 | | 50 day EMA | 15.8 | 15.85 | 15.87 |
SMA (simple moving average) of China Telecom CHA
| SMA period | SMA current | SMA prev | SMA prev2 | | 5 day SMA | 15.4 | 15.29 | 15.08 | | 12 day SMA | 14.51 | 14.48 | 14.44 | | 20 day SMA | 14.61 | 14.64 | 14.62 | | 35 day SMA | 15.34 | 15.39 | 15.43 | | 50 day SMA | 15.7 | 15.75 | 15.78 | | 100 day SMA | 18.3 | 18.42 | 18.54 | | 150 day SMA | 22.1 | 22.23 | 22.36 | | 200 day SMA | 24.09 | 24.18 | 24.27 |
|
|
