CarlyleGroup CG full analysis,charts,indicators,moving averages,SMA,DMA,EMA,ADX,MACD,RSICarlyle Group CG WideScreen charts, DMA,SMA,EMA technical analysis, forecast prediction, by indicators ADX,MACD,RSI,CCI USA stock exchange
operates under Finance sector & deals in Investment Managers
Daily price and charts and targets CarlyleGroup Strong Daily Stock price targets for CarlyleGroup CG are 55.91 and 57.09 | Daily Target 1 | 54.99 | | Daily Target 2 | 55.64 | | Daily Target 3 | 56.166666666667 | | Daily Target 4 | 56.82 | | Daily Target 5 | 57.35 |
Daily price and volume Carlyle Group
| Date |
Closing |
Open |
Range |
Volume |
Thu 04 December 2025 |
56.30 (0.91%) |
55.51 |
55.51 - 56.69 |
1.1298 times |
Wed 03 December 2025 |
55.79 (3.24%) |
54.27 |
54.18 - 55.83 |
0.5851 times |
Tue 02 December 2025 |
54.04 (-0.04%) |
54.44 |
53.83 - 54.65 |
0.7325 times |
Mon 01 December 2025 |
54.06 (-0.86%) |
53.87 |
53.24 - 54.78 |
0.892 times |
Fri 28 November 2025 |
54.53 (1.93%) |
53.50 |
53.33 - 54.65 |
0.4964 times |
Wed 26 November 2025 |
53.50 (1.61%) |
52.83 |
52.60 - 54.01 |
0.7455 times |
Tue 25 November 2025 |
52.65 (1.35%) |
52.14 |
51.32 - 52.91 |
0.4829 times |
Mon 24 November 2025 |
51.95 (0.44%) |
52.00 |
51.43 - 52.37 |
1.3592 times |
Fri 21 November 2025 |
51.72 (1.85%) |
51.16 |
50.42 - 52.42 |
0.8086 times |
Thu 20 November 2025 |
50.78 (-2.29%) |
52.80 |
50.71 - 53.74 |
2.768 times |
Wed 19 November 2025 |
51.97 (0.58%) |
51.89 |
51.02 - 52.01 |
0.9756 times |
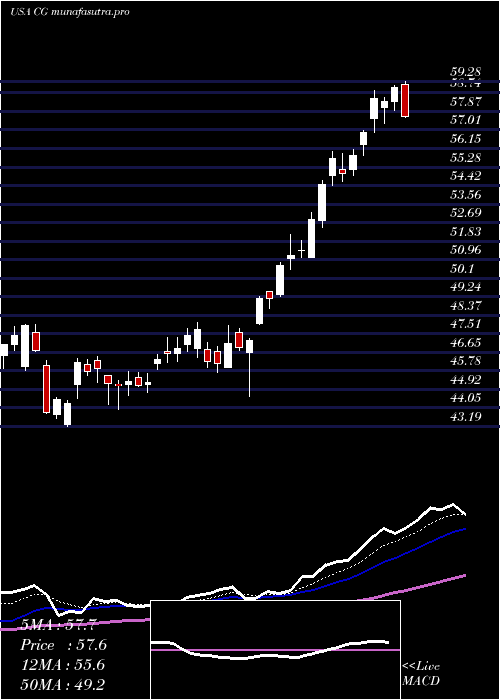
Weekly price and charts CarlyleGroup Strong weekly Stock price targets for CarlyleGroup CG are 54.77 and 58.22 | Weekly Target 1 | 51.96 | | Weekly Target 2 | 54.13 | | Weekly Target 3 | 55.41 | | Weekly Target 4 | 57.58 | | Weekly Target 5 | 58.86 |
Weekly price and volumes for Carlyle Group
| Date |
Closing |
Open |
Range |
Volume |
Thu 04 December 2025 |
56.30 (3.25%) |
53.87 |
53.24 - 56.69 |
0.6797 times |
Fri 28 November 2025 |
54.53 (5.43%) |
52.00 |
51.32 - 54.65 |
0.6277 times |
Fri 21 November 2025 |
51.72 (-3.02%) |
53.08 |
50.42 - 53.74 |
1.2784 times |
Fri 14 November 2025 |
53.33 (1.72%) |
52.67 |
51.56 - 55.28 |
1.3607 times |
Fri 07 November 2025 |
52.43 (-1.67%) |
51.14 |
50.39 - 53.19 |
1.1106 times |
Fri 31 October 2025 |
53.32 (0%) |
52.86 |
50.96 - 54.16 |
0.5874 times |
Fri 31 October 2025 |
53.32 (-8.85%) |
59.46 |
50.96 - 59.81 |
1.4926 times |
Fri 24 October 2025 |
58.50 (2.38%) |
57.67 |
56.05 - 59.59 |
0.8866 times |
Fri 17 October 2025 |
57.14 (1.8%) |
57.66 |
56.35 - 60.70 |
0.8796 times |
Fri 10 October 2025 |
56.13 (-11.12%) |
64.05 |
56.00 - 64.50 |
1.0968 times |
Fri 03 October 2025 |
63.15 (-1.31%) |
64.57 |
60.30 - 65.07 |
1.6399 times |
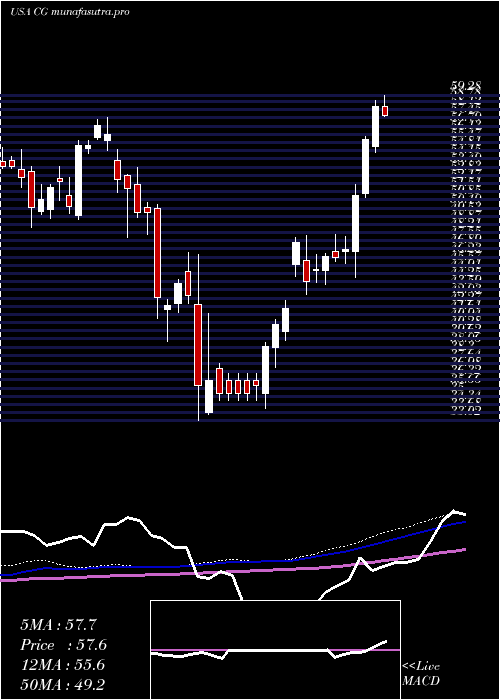
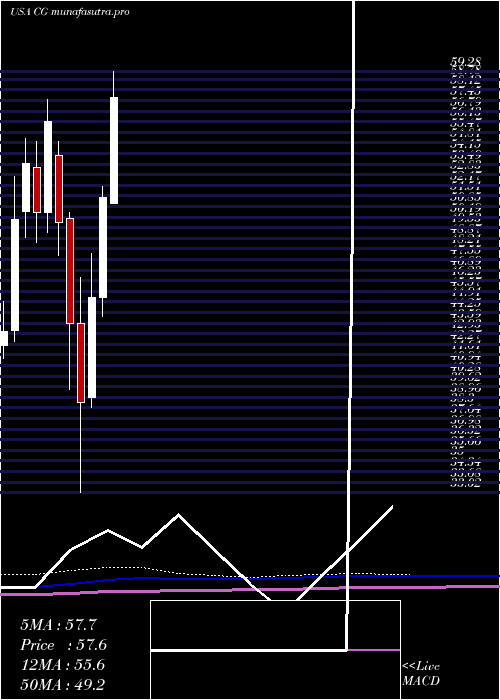
Monthly price and charts CarlyleGroup Strong monthly Stock price targets for CarlyleGroup CG are 54.77 and 58.22 | Monthly Target 1 | 51.96 | | Monthly Target 2 | 54.13 | | Monthly Target 3 | 55.41 | | Monthly Target 4 | 57.58 | | Monthly Target 5 | 58.86 |
Monthly price and volumes Carlyle Group
| Date |
Closing |
Open |
Range |
Volume |
Thu 04 December 2025 |
56.30 (3.25%) |
53.87 |
53.24 - 56.69 |
0.1482 times |
Fri 28 November 2025 |
54.53 (2.27%) |
51.14 |
50.39 - 55.28 |
0.9544 times |
Fri 31 October 2025 |
53.32 (-14.96%) |
62.88 |
50.96 - 64.50 |
1.2636 times |
Tue 30 September 2025 |
62.70 (-2.88%) |
63.06 |
61.01 - 69.85 |
1.198 times |
Fri 29 August 2025 |
64.56 (6.43%) |
58.51 |
56.91 - 65.97 |
1.0488 times |
Thu 31 July 2025 |
60.66 (18.02%) |
51.06 |
51.05 - 63.74 |
0.9532 times |
Mon 30 June 2025 |
51.40 (13.72%) |
45.15 |
43.98 - 52.12 |
0.786 times |
Fri 30 May 2025 |
45.20 (16.98%) |
38.98 |
38.36 - 47.95 |
1.0437 times |
Wed 30 April 2025 |
38.64 (-11.36%) |
43.58 |
33.02 - 46.40 |
1.5758 times |
Mon 31 March 2025 |
43.59 (-12.54%) |
50.13 |
39.44 - 50.46 |
1.0282 times |
Fri 28 February 2025 |
49.84 (-11.25%) |
54.03 |
47.78 - 54.90 |
0.9586 times |
DMA SMA EMA moving averages of Carlyle Group CG
DMA (daily moving average) of Carlyle Group CG
| DMA period | DMA value | | 5 day DMA | 54.94 | | 12 day DMA | 53.25 | | 20 day DMA | 53.17 | | 35 day DMA | 54.52 | | 50 day DMA | 56.54 | | 100 day DMA | 60.1 | | 150 day DMA | 56.01 | | 200 day DMA | 52.42 | EMA (exponential moving average) of Carlyle Group CG
| EMA period | EMA current | EMA prev | EMA prev2 | | 5 day EMA | 55.02 | 54.38 | 53.68 | | 12 day EMA | 54.06 | 53.65 | 53.26 | | 20 day EMA | 54.1 | 53.87 | 53.67 | | 35 day EMA | 55.52 | 55.47 | 55.45 | | 50 day EMA | 57.27 | 57.31 | 57.37 |
SMA (simple moving average) of Carlyle Group CG
| SMA period | SMA current | SMA prev | SMA prev2 | | 5 day SMA | 54.94 | 54.38 | 53.76 | | 12 day SMA | 53.25 | 52.84 | 52.63 | | 20 day SMA | 53.17 | 52.96 | 52.73 | | 35 day SMA | 54.52 | 54.6 | 54.71 | | 50 day SMA | 56.54 | 56.7 | 56.92 | | 100 day SMA | 60.1 | 60.11 | 60.14 | | 150 day SMA | 56.01 | 55.89 | 55.78 | | 200 day SMA | 52.42 | 52.41 | 52.39 |
|
|
