CapitolFederal CFFN full analysis,charts,indicators,moving averages,SMA,DMA,EMA,ADX,MACD,RSICapitol Federal CFFN WideScreen charts, DMA,SMA,EMA technical analysis, forecast prediction, by indicators ADX,MACD,RSI,CCI USA stock exchange
operates under Finance sector & deals in Savings Institutions
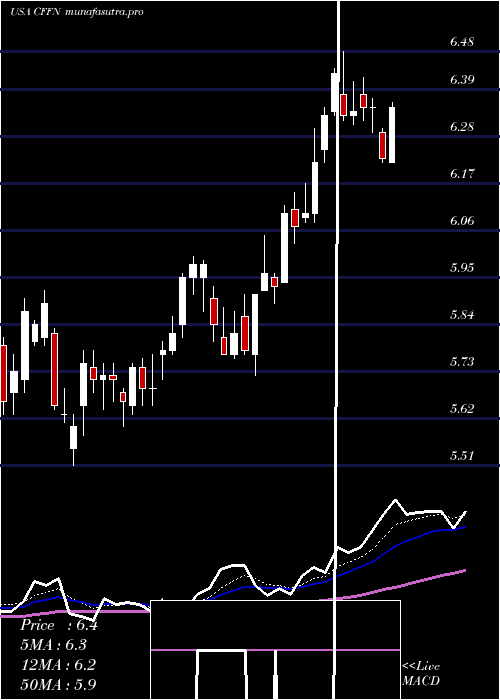
Daily price and charts and targets CapitolFederal Strong Daily Stock price targets for CapitolFederal CFFN are 6.69 and 6.78 | Daily Target 1 | 6.67 | | Daily Target 2 | 6.7 | | Daily Target 3 | 6.7566666666667 | | Daily Target 4 | 6.79 | | Daily Target 5 | 6.85 |
Daily price and volume Capitol Federal
| Date |
Closing |
Open |
Range |
Volume |
Thu 04 December 2025 |
6.74 (-1.32%) |
6.79 |
6.72 - 6.81 |
0.7732 times |
Wed 03 December 2025 |
6.83 (1.34%) |
6.77 |
6.75 - 6.83 |
1.2445 times |
Tue 02 December 2025 |
6.74 (1.51%) |
6.68 |
6.63 - 6.75 |
1.167 times |
Mon 01 December 2025 |
6.64 (0.45%) |
6.54 |
6.54 - 6.69 |
0.8266 times |
Fri 28 November 2025 |
6.61 (-0.6%) |
6.64 |
6.60 - 6.68 |
0.5875 times |
Wed 26 November 2025 |
6.65 (0%) |
6.58 |
6.57 - 6.70 |
0.7132 times |
Tue 25 November 2025 |
6.65 (2.78%) |
6.50 |
6.48 - 6.70 |
1.3999 times |
Mon 24 November 2025 |
6.47 (0.78%) |
6.42 |
6.38 - 6.47 |
1.161 times |
Fri 21 November 2025 |
6.42 (4.05%) |
6.17 |
6.17 - 6.47 |
1.3601 times |
Thu 20 November 2025 |
6.17 (0.65%) |
6.20 |
6.13 - 6.32 |
0.7669 times |
Wed 19 November 2025 |
6.13 (-0.33%) |
6.14 |
6.07 - 6.17 |
0.5999 times |
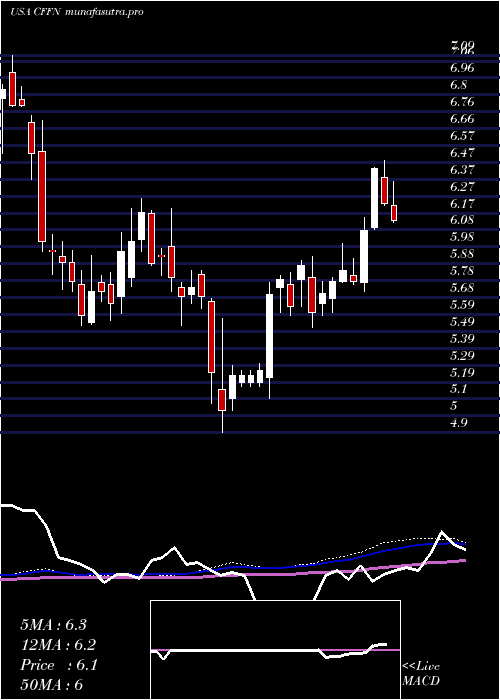
Weekly price and charts CapitolFederal Strong weekly Stock price targets for CapitolFederal CFFN are 6.64 and 6.93 | Weekly Target 1 | 6.41 | | Weekly Target 2 | 6.58 | | Weekly Target 3 | 6.7033333333333 | | Weekly Target 4 | 6.87 | | Weekly Target 5 | 6.99 |
Weekly price and volumes for Capitol Federal
| Date |
Closing |
Open |
Range |
Volume |
Thu 04 December 2025 |
6.74 (1.97%) |
6.54 |
6.54 - 6.83 |
1.0708 times |
Fri 28 November 2025 |
6.61 (2.96%) |
6.42 |
6.38 - 6.70 |
1.0308 times |
Fri 21 November 2025 |
6.42 (1.42%) |
6.32 |
6.07 - 6.47 |
1.117 times |
Fri 14 November 2025 |
6.33 (2.1%) |
6.20 |
6.18 - 6.46 |
1.0134 times |
Fri 07 November 2025 |
6.20 (2.65%) |
6.17 |
6.10 - 6.31 |
0.9106 times |
Fri 31 October 2025 |
6.04 (0%) |
5.99 |
5.97 - 6.06 |
0.2621 times |
Fri 31 October 2025 |
6.04 (-6.36%) |
6.44 |
5.97 - 6.47 |
1.3025 times |
Fri 24 October 2025 |
6.45 (4.71%) |
6.20 |
6.16 - 6.46 |
0.9743 times |
Fri 17 October 2025 |
6.16 (1.32%) |
6.15 |
5.98 - 6.43 |
1.2705 times |
Fri 10 October 2025 |
6.08 (-3.18%) |
6.32 |
6.08 - 6.44 |
1.048 times |
Fri 03 October 2025 |
6.28 (-1.72%) |
6.40 |
6.21 - 6.40 |
0.8781 times |
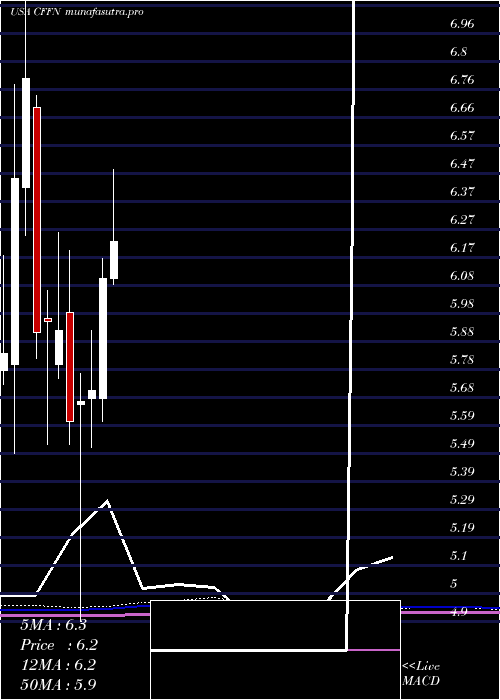
Monthly price and charts CapitolFederal Strong monthly Stock price targets for CapitolFederal CFFN are 6.64 and 6.93 | Monthly Target 1 | 6.41 | | Monthly Target 2 | 6.58 | | Monthly Target 3 | 6.7033333333333 | | Monthly Target 4 | 6.87 | | Monthly Target 5 | 6.99 |
Monthly price and volumes Capitol Federal
| Date |
Closing |
Open |
Range |
Volume |
Thu 04 December 2025 |
6.74 (1.97%) |
6.54 |
6.54 - 6.83 |
0.2219 times |
Fri 28 November 2025 |
6.61 (9.44%) |
6.17 |
6.07 - 6.70 |
0.8437 times |
Fri 31 October 2025 |
6.04 (-4.88%) |
6.29 |
5.97 - 6.47 |
1.1077 times |
Tue 30 September 2025 |
6.35 (-2.01%) |
6.40 |
6.25 - 6.62 |
0.9466 times |
Fri 29 August 2025 |
6.48 (7.64%) |
5.88 |
5.71 - 6.53 |
0.8988 times |
Thu 31 July 2025 |
6.02 (-1.31%) |
6.10 |
5.99 - 6.48 |
0.9822 times |
Mon 30 June 2025 |
6.10 (6.83%) |
5.68 |
5.60 - 6.17 |
1.3192 times |
Fri 30 May 2025 |
5.71 (0.71%) |
5.68 |
5.51 - 5.92 |
1.5064 times |
Wed 30 April 2025 |
5.67 (1.25%) |
5.66 |
4.90 - 5.77 |
1.3023 times |
Mon 31 March 2025 |
5.60 (-5.41%) |
5.98 |
5.52 - 6.20 |
0.8713 times |
Fri 28 February 2025 |
5.92 (-0.5%) |
5.80 |
5.75 - 6.26 |
0.7527 times |
DMA SMA EMA moving averages of Capitol Federal CFFN
DMA (daily moving average) of Capitol Federal CFFN
| DMA period | DMA value | | 5 day DMA | 6.71 | | 12 day DMA | 6.52 | | 20 day DMA | 6.42 | | 35 day DMA | 6.33 | | 50 day DMA | 6.32 | | 100 day DMA | 6.28 | | 150 day DMA | 6.15 | | 200 day DMA | 6.02 | EMA (exponential moving average) of Capitol Federal CFFN
| EMA period | EMA current | EMA prev | EMA prev2 | | 5 day EMA | 6.71 | 6.7 | 6.63 | | 12 day EMA | 6.57 | 6.54 | 6.49 | | 20 day EMA | 6.49 | 6.46 | 6.42 | | 35 day EMA | 6.42 | 6.4 | 6.37 | | 50 day EMA | 6.37 | 6.35 | 6.33 |
SMA (simple moving average) of Capitol Federal CFFN
| SMA period | SMA current | SMA prev | SMA prev2 | | 5 day SMA | 6.71 | 6.69 | 6.66 | | 12 day SMA | 6.52 | 6.46 | 6.42 | | 20 day SMA | 6.42 | 6.39 | 6.36 | | 35 day SMA | 6.33 | 6.32 | 6.3 | | 50 day SMA | 6.32 | 6.31 | 6.31 | | 100 day SMA | 6.28 | 6.28 | 6.27 | | 150 day SMA | 6.15 | 6.15 | 6.14 | | 200 day SMA | 6.02 | 6.01 | 6.01 |
|
|
