CF CFFI full analysis,charts,indicators,moving averages,SMA,DMA,EMA,ADX,MACD,RSIC F CFFI WideScreen charts, DMA,SMA,EMA technical analysis, forecast prediction, by indicators ADX,MACD,RSI,CCI USA stock exchange
operates under Finance sector & deals in Major Banks
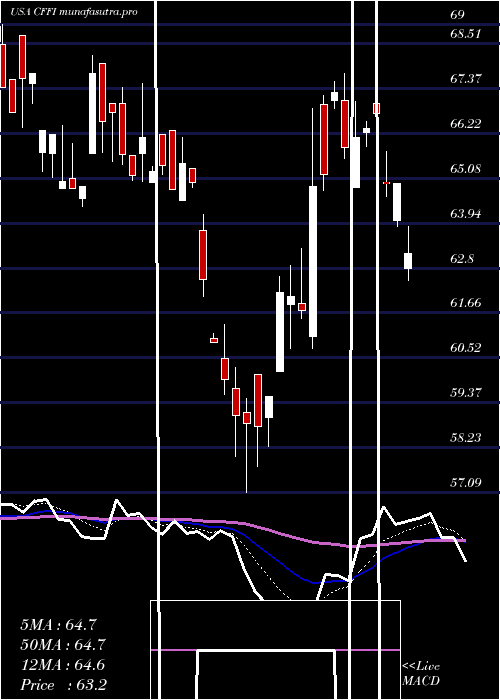
Daily price and charts and targets CF Strong Daily Stock price targets for CF CFFI are 69.03 and 69.72 | Daily Target 1 | 68.46 | | Daily Target 2 | 68.91 | | Daily Target 3 | 69.153333333333 | | Daily Target 4 | 69.6 | | Daily Target 5 | 69.84 |
Daily price and volume C F
| Date |
Closing |
Open |
Range |
Volume |
Tue 21 October 2025 |
69.35 (-0.06%) |
69.32 |
68.71 - 69.40 |
0.5357 times |
Mon 20 October 2025 |
69.39 (1.52%) |
69.05 |
68.96 - 69.39 |
0.5804 times |
Fri 17 October 2025 |
68.35 (2%) |
66.88 |
66.78 - 68.35 |
0.7143 times |
Thu 16 October 2025 |
67.01 (-2.88%) |
69.15 |
67.01 - 69.15 |
1.25 times |
Wed 15 October 2025 |
69.00 (1.02%) |
67.68 |
67.68 - 69.23 |
0.8482 times |
Tue 14 October 2025 |
68.30 (1.8%) |
67.65 |
67.61 - 68.48 |
0.8929 times |
Mon 13 October 2025 |
67.09 (2.54%) |
66.30 |
66.30 - 67.09 |
1.0491 times |
Fri 10 October 2025 |
65.43 (-2.55%) |
66.78 |
65.43 - 66.84 |
1.4063 times |
Thu 09 October 2025 |
67.14 (1.21%) |
66.33 |
66.33 - 67.14 |
0.5804 times |
Wed 08 October 2025 |
66.34 (1.78%) |
65.90 |
65.90 - 67.51 |
2.1429 times |
Tue 07 October 2025 |
65.18 (-2.03%) |
66.79 |
64.71 - 66.79 |
0.8482 times |
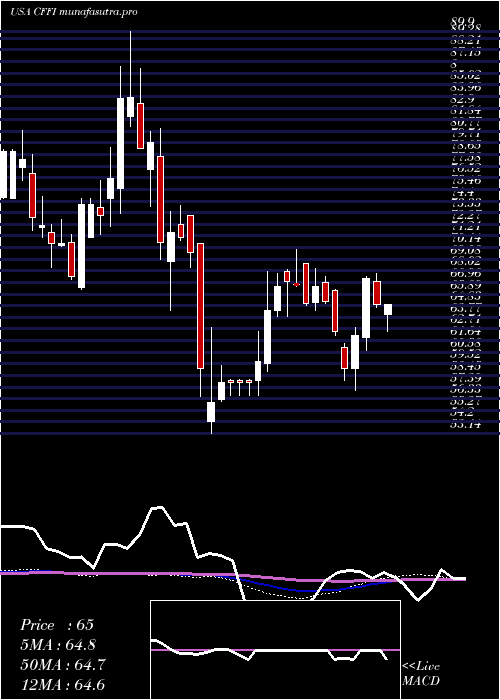
Weekly price and charts CF Strong weekly Stock price targets for CF CFFI are 69.03 and 69.72 | Weekly Target 1 | 68.46 | | Weekly Target 2 | 68.91 | | Weekly Target 3 | 69.153333333333 | | Weekly Target 4 | 69.6 | | Weekly Target 5 | 69.84 |
Weekly price and volumes for C F
| Date |
Closing |
Open |
Range |
Volume |
Tue 21 October 2025 |
69.35 (1.46%) |
69.05 |
68.71 - 69.40 |
0.1914 times |
Fri 17 October 2025 |
68.35 (4.46%) |
66.30 |
66.30 - 69.23 |
0.8153 times |
Fri 10 October 2025 |
65.43 (-3.28%) |
68.01 |
64.71 - 68.06 |
1.0066 times |
Fri 03 October 2025 |
67.65 (-1.38%) |
66.20 |
65.39 - 68.43 |
0.8943 times |
Fri 26 September 2025 |
68.60 (-4.62%) |
69.25 |
67.41 - 69.58 |
0.8191 times |
Fri 19 September 2025 |
71.92 (2.57%) |
69.95 |
68.01 - 72.00 |
1.6343 times |
Fri 12 September 2025 |
70.12 (-1.65%) |
71.50 |
69.63 - 72.00 |
0.8803 times |
Fri 05 September 2025 |
71.30 (-0.94%) |
70.72 |
69.47 - 73.00 |
1.4583 times |
Fri 29 August 2025 |
71.98 (0%) |
70.60 |
70.60 - 71.98 |
0.467 times |
Fri 29 August 2025 |
71.98 (0.81%) |
70.55 |
69.85 - 72.35 |
1.8334 times |
Fri 22 August 2025 |
71.40 (4.1%) |
67.89 |
66.91 - 72.07 |
1.8296 times |
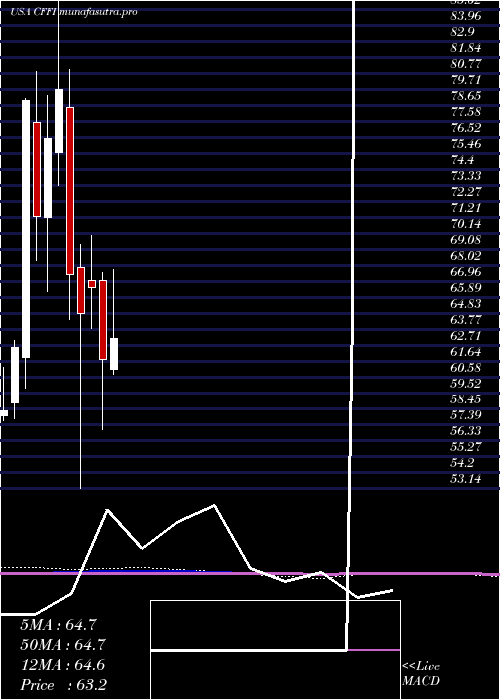
Monthly price and charts CF Strong monthly Stock price targets for CF CFFI are 67.03 and 71.72 | Monthly Target 1 | 63.13 | | Monthly Target 2 | 66.24 | | Monthly Target 3 | 67.82 | | Monthly Target 4 | 70.93 | | Monthly Target 5 | 72.51 |
Monthly price and volumes C F
| Date |
Closing |
Open |
Range |
Volume |
Tue 21 October 2025 |
69.35 (3.2%) |
66.80 |
64.71 - 69.40 |
0.2591 times |
Tue 30 September 2025 |
67.20 (-6.64%) |
70.72 |
65.39 - 73.00 |
0.531 times |
Fri 29 August 2025 |
71.98 (12.73%) |
63.64 |
61.45 - 72.35 |
0.9835 times |
Thu 31 July 2025 |
63.85 (3.43%) |
61.07 |
60.76 - 69.66 |
1.5076 times |
Mon 30 June 2025 |
61.73 (-7.23%) |
66.98 |
57.09 - 67.50 |
2.6705 times |
Fri 30 May 2025 |
66.54 (2.73%) |
67.00 |
63.81 - 69.99 |
0.4666 times |
Wed 30 April 2025 |
64.77 (-3.89%) |
67.86 |
53.14 - 69.37 |
1.022 times |
Mon 31 March 2025 |
67.39 (-15.45%) |
78.49 |
64.39 - 81.00 |
0.7779 times |
Fri 28 February 2025 |
79.70 (4.29%) |
75.53 |
73.30 - 89.90 |
0.8126 times |
Fri 31 January 2025 |
76.42 (7.26%) |
71.18 |
66.29 - 79.32 |
0.9691 times |
Tue 31 December 2024 |
71.25 (-9.73%) |
77.50 |
68.32 - 80.87 |
0.572 times |
DMA SMA EMA moving averages of C F CFFI
DMA (daily moving average) of C F CFFI
| DMA period | DMA value | | 5 day DMA | 68.62 | | 12 day DMA | 67.43 | | 20 day DMA | 67.48 | | 35 day DMA | 68.79 | | 50 day DMA | 69.13 | | 100 day DMA | 66.92 | | 150 day DMA | 66.11 | | 200 day DMA | 68.51 | EMA (exponential moving average) of C F CFFI
| EMA period | EMA current | EMA prev | EMA prev2 | | 5 day EMA | 68.66 | 68.32 | 67.78 | | 12 day EMA | 68.06 | 67.82 | 67.53 | | 20 day EMA | 68.03 | 67.89 | 67.73 | | 35 day EMA | 68.2 | 68.13 | 68.06 | | 50 day EMA | 68.76 | 68.74 | 68.71 |
SMA (simple moving average) of C F CFFI
| SMA period | SMA current | SMA prev | SMA prev2 | | 5 day SMA | 68.62 | 68.41 | 67.95 | | 12 day SMA | 67.43 | 67.28 | 67.02 | | 20 day SMA | 67.48 | 67.46 | 67.42 | | 35 day SMA | 68.79 | 68.83 | 68.9 | | 50 day SMA | 69.13 | 69.11 | 69.03 | | 100 day SMA | 66.92 | 66.87 | 66.83 | | 150 day SMA | 66.11 | 66.14 | 66.15 | | 200 day SMA | 68.51 | 68.52 | 68.52 |
|
|
