VictorysharesUs CFA full analysis,charts,indicators,moving averages,SMA,DMA,EMA,ADX,MACD,RSIVictoryshares Us CFA WideScreen charts, DMA,SMA,EMA technical analysis, forecast prediction, by indicators ADX,MACD,RSI,CCI USA stock exchange
operates under N A sector & deals in N A
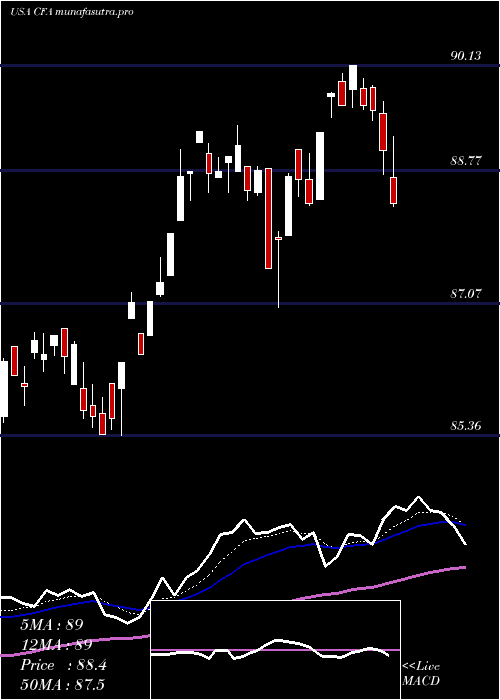
Daily price and charts and targets VictorysharesUs Strong Daily Stock price targets for VictorysharesUs CFA are 90.97 and 91.37 | Daily Target 1 | 90.67 | | Daily Target 2 | 90.86 | | Daily Target 3 | 91.073333333333 | | Daily Target 4 | 91.26 | | Daily Target 5 | 91.47 |
Daily price and volume Victoryshares Us
| Date |
Closing |
Open |
Range |
Volume |
Thu 04 December 2025 |
91.04 (0.05%) |
90.89 |
90.89 - 91.29 |
1.6776 times |
Wed 03 December 2025 |
90.99 (0.55%) |
90.67 |
90.67 - 91.10 |
1.329 times |
Tue 02 December 2025 |
90.49 (-0.17%) |
90.61 |
90.42 - 90.62 |
0.6536 times |
Mon 01 December 2025 |
90.64 (-0.82%) |
90.63 |
90.63 - 91.29 |
0.6318 times |
Fri 28 November 2025 |
91.39 (0.45%) |
91.10 |
91.04 - 91.48 |
0.6754 times |
Wed 26 November 2025 |
90.98 (0.63%) |
91.05 |
90.98 - 91.18 |
0.9586 times |
Tue 25 November 2025 |
90.41 (1.42%) |
89.39 |
89.39 - 90.48 |
0.5229 times |
Mon 24 November 2025 |
89.14 (0.42%) |
88.65 |
88.65 - 89.32 |
0.61 times |
Fri 21 November 2025 |
88.77 (1.65%) |
87.60 |
87.48 - 89.26 |
2.0044 times |
Thu 20 November 2025 |
87.33 (-1.03%) |
89.10 |
87.20 - 89.10 |
0.9368 times |
Wed 19 November 2025 |
88.24 (-0.35%) |
88.39 |
88.04 - 88.58 |
2.8322 times |
Weekly price and charts VictorysharesUs Strong weekly Stock price targets for VictorysharesUs CFA are 90.73 and 91.6 | Weekly Target 1 | 90.05 | | Weekly Target 2 | 90.54 | | Weekly Target 3 | 90.916666666667 | | Weekly Target 4 | 91.41 | | Weekly Target 5 | 91.79 |
Weekly price and volumes for Victoryshares Us
| Date |
Closing |
Open |
Range |
Volume |
Thu 04 December 2025 |
91.04 (-0.38%) |
90.63 |
90.42 - 91.29 |
0.8225 times |
Fri 28 November 2025 |
91.39 (2.95%) |
88.65 |
88.65 - 91.48 |
0.5303 times |
Fri 21 November 2025 |
88.77 (-0.93%) |
89.48 |
87.20 - 89.55 |
1.4739 times |
Fri 14 November 2025 |
89.60 (-0.13%) |
90.08 |
89.24 - 91.16 |
1.4363 times |
Fri 07 November 2025 |
89.72 (-0.18%) |
88.93 |
88.76 - 89.83 |
1.2401 times |
Fri 31 October 2025 |
89.88 (0%) |
89.41 |
89.41 - 89.88 |
0.3257 times |
Fri 31 October 2025 |
89.88 (-1.26%) |
91.37 |
89.33 - 91.38 |
1.357 times |
Fri 24 October 2025 |
91.03 (1.44%) |
90.28 |
90.28 - 91.41 |
1.0647 times |
Fri 17 October 2025 |
89.74 (1.16%) |
89.29 |
88.81 - 90.74 |
0.7557 times |
Fri 10 October 2025 |
88.71 (-2.91%) |
91.55 |
88.71 - 91.62 |
0.9937 times |
Fri 03 October 2025 |
91.37 (0.95%) |
90.75 |
90.39 - 91.75 |
1.029 times |

Monthly price and charts VictorysharesUs Strong monthly Stock price targets for VictorysharesUs CFA are 90.73 and 91.6 | Monthly Target 1 | 90.05 | | Monthly Target 2 | 90.54 | | Monthly Target 3 | 90.916666666667 | | Monthly Target 4 | 91.41 | | Monthly Target 5 | 91.79 |
Monthly price and volumes Victoryshares Us
| Date |
Closing |
Open |
Range |
Volume |
Thu 04 December 2025 |
91.04 (-0.38%) |
90.63 |
90.42 - 91.29 |
0.1263 times |
Fri 28 November 2025 |
91.39 (1.68%) |
88.93 |
87.20 - 91.48 |
0.7189 times |
Fri 31 October 2025 |
89.88 (-1.21%) |
90.86 |
88.71 - 91.75 |
0.7858 times |
Tue 30 September 2025 |
90.98 (0.72%) |
89.56 |
89.38 - 91.22 |
0.8991 times |
Fri 29 August 2025 |
90.33 (2.24%) |
87.74 |
86.99 - 91.18 |
1.1036 times |
Thu 31 July 2025 |
88.35 (0.44%) |
88.13 |
87.00 - 90.13 |
1.4575 times |
Mon 30 June 2025 |
87.96 (2.75%) |
85.37 |
84.73 - 87.96 |
0.8183 times |
Fri 30 May 2025 |
85.61 (4.03%) |
82.43 |
82.19 - 87.34 |
0.9542 times |
Wed 30 April 2025 |
82.29 (-2.55%) |
84.49 |
73.98 - 85.42 |
1.2984 times |
Mon 31 March 2025 |
84.44 (-3.53%) |
87.84 |
81.63 - 87.94 |
1.8378 times |
Fri 28 February 2025 |
87.53 (-0.86%) |
86.96 |
86.17 - 88.70 |
1.3223 times |

DMA SMA EMA moving averages of Victoryshares Us CFA
DMA (daily moving average) of Victoryshares Us CFA
| DMA period | DMA value | | 5 day DMA | 90.91 | | 12 day DMA | 89.83 | | 20 day DMA | 89.82 | | 35 day DMA | 89.98 | | 50 day DMA | 90.14 | | 100 day DMA | 89.9 | | 150 day DMA | 88.7 | | 200 day DMA | 87.21 | EMA (exponential moving average) of Victoryshares Us CFA
| EMA period | EMA current | EMA prev | EMA prev2 | | 5 day EMA | 90.77 | 90.64 | 90.46 | | 12 day EMA | 90.3 | 90.17 | 90.02 | | 20 day EMA | 90.12 | 90.02 | 89.92 | | 35 day EMA | 90.1 | 90.04 | 89.98 | | 50 day EMA | 90.23 | 90.2 | 90.17 |
SMA (simple moving average) of Victoryshares Us CFA
| SMA period | SMA current | SMA prev | SMA prev2 | | 5 day SMA | 90.91 | 90.9 | 90.78 | | 12 day SMA | 89.83 | 89.62 | 89.51 | | 20 day SMA | 89.82 | 89.75 | 89.66 | | 35 day SMA | 89.98 | 89.95 | 89.93 | | 50 day SMA | 90.14 | 90.12 | 90.11 | | 100 day SMA | 89.9 | 89.87 | 89.84 | | 150 day SMA | 88.7 | 88.64 | 88.58 | | 200 day SMA | 87.21 | 87.2 | 87.19 |
|
|
