CerusCorporation CERS full analysis,charts,indicators,moving averages,SMA,DMA,EMA,ADX,MACD,RSICerus Corporation CERS WideScreen charts, DMA,SMA,EMA technical analysis, forecast prediction, by indicators ADX,MACD,RSI,CCI USA stock exchange
operates under Health Care sector & deals in Medical Dental Instruments
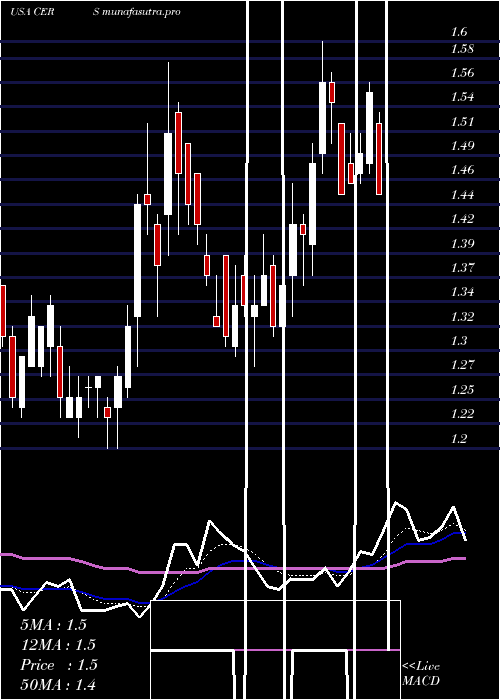
Daily price and charts and targets CerusCorporation Strong Daily Stock price targets for CerusCorporation CERS are 2.03 and 2.18 | Daily Target 1 | 1.91 | | Daily Target 2 | 2 | | Daily Target 3 | 2.0566666666667 | | Daily Target 4 | 2.15 | | Daily Target 5 | 2.21 |
Daily price and volume Cerus Corporation
| Date |
Closing |
Open |
Range |
Volume |
Thu 04 December 2025 |
2.10 (5.53%) |
1.97 |
1.96 - 2.11 |
0.9744 times |
Wed 03 December 2025 |
1.99 (6.42%) |
1.85 |
1.85 - 2.02 |
1.244 times |
Tue 02 December 2025 |
1.87 (3.89%) |
1.80 |
1.79 - 1.90 |
0.9727 times |
Mon 01 December 2025 |
1.80 (2.27%) |
1.73 |
1.71 - 1.83 |
1.1329 times |
Fri 28 November 2025 |
1.76 (0%) |
1.76 |
1.74 - 1.78 |
0.4179 times |
Wed 26 November 2025 |
1.76 (-0.56%) |
1.77 |
1.69 - 1.77 |
0.7034 times |
Tue 25 November 2025 |
1.77 (4.73%) |
1.70 |
1.67 - 1.78 |
1.3034 times |
Mon 24 November 2025 |
1.69 (4.32%) |
1.62 |
1.59 - 1.74 |
1.1976 times |
Fri 21 November 2025 |
1.62 (8.72%) |
1.48 |
1.47 - 1.67 |
1.3808 times |
Thu 20 November 2025 |
1.49 (-1.32%) |
1.54 |
1.48 - 1.59 |
0.6728 times |
Wed 19 November 2025 |
1.51 (1.34%) |
1.50 |
1.48 - 1.58 |
0.7064 times |
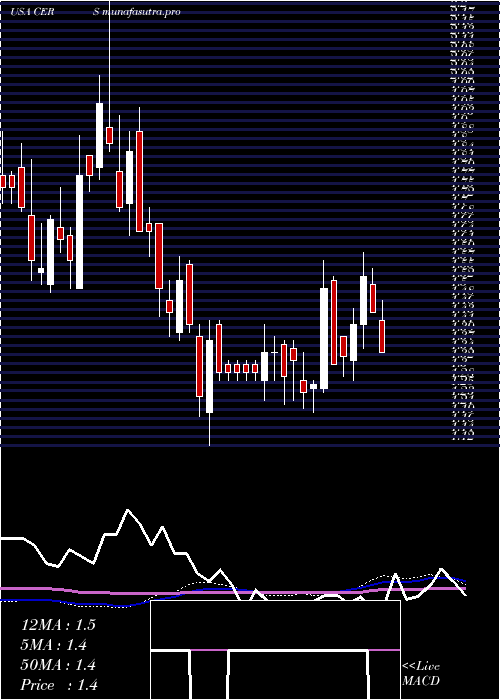
Weekly price and charts CerusCorporation Strong weekly Stock price targets for CerusCorporation CERS are 1.91 and 2.31 | Weekly Target 1 | 1.57 | | Weekly Target 2 | 1.84 | | Weekly Target 3 | 1.9733333333333 | | Weekly Target 4 | 2.24 | | Weekly Target 5 | 2.37 |
Weekly price and volumes for Cerus Corporation
| Date |
Closing |
Open |
Range |
Volume |
Thu 04 December 2025 |
2.10 (19.32%) |
1.73 |
1.71 - 2.11 |
1.2146 times |
Fri 28 November 2025 |
1.76 (8.64%) |
1.62 |
1.59 - 1.78 |
1.0175 times |
Fri 21 November 2025 |
1.62 (0%) |
1.59 |
1.47 - 1.67 |
1.0977 times |
Fri 14 November 2025 |
1.62 (-5.81%) |
1.71 |
1.54 - 1.78 |
1.1812 times |
Fri 07 November 2025 |
1.72 (17.01%) |
1.47 |
1.38 - 1.73 |
1.056 times |
Fri 31 October 2025 |
1.47 (0%) |
1.40 |
1.40 - 1.50 |
0.2303 times |
Fri 31 October 2025 |
1.47 (-3.92%) |
1.53 |
1.40 - 1.55 |
0.9284 times |
Fri 24 October 2025 |
1.53 (0%) |
1.55 |
1.48 - 1.66 |
0.9887 times |
Fri 17 October 2025 |
1.53 (-4.38%) |
1.63 |
1.50 - 1.68 |
1.0369 times |
Fri 10 October 2025 |
1.60 (1.91%) |
1.59 |
1.52 - 1.70 |
1.2488 times |
Fri 03 October 2025 |
1.57 (9.03%) |
1.45 |
1.45 - 1.61 |
1.1999 times |
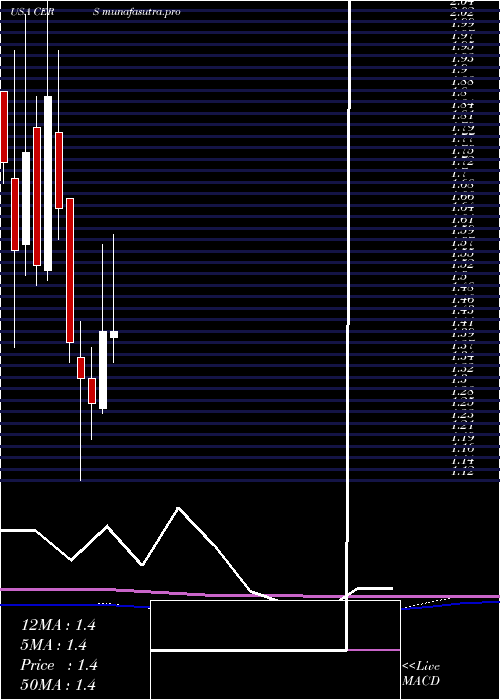
Monthly price and charts CerusCorporation Strong monthly Stock price targets for CerusCorporation CERS are 1.91 and 2.31 | Monthly Target 1 | 1.57 | | Monthly Target 2 | 1.84 | | Monthly Target 3 | 1.9733333333333 | | Monthly Target 4 | 2.24 | | Monthly Target 5 | 2.37 |
Monthly price and volumes Cerus Corporation
| Date |
Closing |
Open |
Range |
Volume |
Thu 04 December 2025 |
2.10 (19.32%) |
1.73 |
1.71 - 2.11 |
0.2772 times |
Fri 28 November 2025 |
1.76 (19.73%) |
1.47 |
1.38 - 1.78 |
0.9933 times |
Fri 31 October 2025 |
1.47 (-7.55%) |
1.59 |
1.40 - 1.70 |
1.1808 times |
Tue 30 September 2025 |
1.59 (21.37%) |
1.27 |
1.17 - 1.67 |
1.3385 times |
Fri 29 August 2025 |
1.31 (2.34%) |
1.28 |
1.15 - 1.44 |
1.0338 times |
Thu 31 July 2025 |
1.28 (-9.22%) |
1.40 |
1.27 - 1.60 |
0.8239 times |
Mon 30 June 2025 |
1.41 (11.02%) |
1.26 |
1.25 - 1.58 |
1.1349 times |
Fri 30 May 2025 |
1.27 (-3.79%) |
1.32 |
1.20 - 1.38 |
1.0029 times |
Wed 30 April 2025 |
1.32 (-5.04%) |
1.36 |
1.12 - 1.43 |
1.0164 times |
Mon 31 March 2025 |
1.39 (-15.76%) |
1.67 |
1.35 - 1.67 |
1.1984 times |
Fri 28 February 2025 |
1.65 (-11.76%) |
1.80 |
1.59 - 1.96 |
0.9221 times |
DMA SMA EMA moving averages of Cerus Corporation CERS
DMA (daily moving average) of Cerus Corporation CERS
| DMA period | DMA value | | 5 day DMA | 1.9 | | 12 day DMA | 1.74 | | 20 day DMA | 1.68 | | 35 day DMA | 1.61 | | 50 day DMA | 1.6 | | 100 day DMA | 1.45 | | 150 day DMA | 1.42 | | 200 day DMA | 1.43 | EMA (exponential moving average) of Cerus Corporation CERS
| EMA period | EMA current | EMA prev | EMA prev2 | | 5 day EMA | 1.93 | 1.85 | 1.78 | | 12 day EMA | 1.8 | 1.74 | 1.69 | | 20 day EMA | 1.73 | 1.69 | 1.66 | | 35 day EMA | 1.67 | 1.64 | 1.62 | | 50 day EMA | 1.62 | 1.6 | 1.58 |
SMA (simple moving average) of Cerus Corporation CERS
| SMA period | SMA current | SMA prev | SMA prev2 | | 5 day SMA | 1.9 | 1.84 | 1.79 | | 12 day SMA | 1.74 | 1.69 | 1.66 | | 20 day SMA | 1.68 | 1.65 | 1.62 | | 35 day SMA | 1.61 | 1.59 | 1.58 | | 50 day SMA | 1.6 | 1.59 | 1.58 | | 100 day SMA | 1.45 | 1.45 | 1.44 | | 150 day SMA | 1.42 | 1.42 | 1.41 | | 200 day SMA | 1.43 | 1.43 | 1.43 |
|
|
