CentralGarden CENT full analysis,charts,indicators,moving averages,SMA,DMA,EMA,ADX,MACD,RSICentral Garden CENT WideScreen charts, DMA,SMA,EMA technical analysis, forecast prediction, by indicators ADX,MACD,RSI,CCI USA stock exchange
operates under Consumer Durables sector & deals in Consumer Specialties
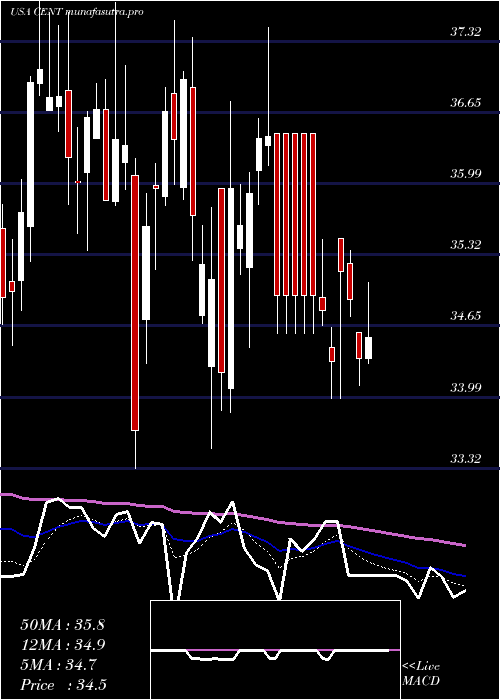
Daily price and charts and targets CentralGarden Strong Daily Stock price targets for CentralGarden CENT are 32.83 and 33.89 | Daily Target 1 | 32.59 | | Daily Target 2 | 33.07 | | Daily Target 3 | 33.653333333333 | | Daily Target 4 | 34.13 | | Daily Target 5 | 34.71 |
Daily price and volume Central Garden
| Date |
Closing |
Open |
Range |
Volume |
Thu 04 December 2025 |
33.54 (-1.06%) |
33.83 |
33.18 - 34.24 |
0.8677 times |
Wed 03 December 2025 |
33.90 (0.8%) |
33.65 |
33.65 - 34.17 |
0.4833 times |
Tue 02 December 2025 |
33.63 (-0.24%) |
33.82 |
33.23 - 34.33 |
0.7926 times |
Mon 01 December 2025 |
33.71 (-1.32%) |
33.89 |
33.56 - 34.37 |
0.9931 times |
Fri 28 November 2025 |
34.16 (-0.15%) |
34.62 |
33.85 - 34.62 |
0.562 times |
Wed 26 November 2025 |
34.21 (0.18%) |
34.15 |
33.94 - 34.70 |
1.4835 times |
Tue 25 November 2025 |
34.15 (8.65%) |
32.89 |
32.89 - 35.93 |
2.2911 times |
Mon 24 November 2025 |
31.43 (-2.66%) |
32.11 |
30.80 - 32.54 |
1.1986 times |
Fri 21 November 2025 |
32.29 (4.84%) |
30.95 |
30.67 - 32.36 |
0.698 times |
Thu 20 November 2025 |
30.80 (1.08%) |
30.66 |
30.39 - 31.00 |
0.63 times |
Wed 19 November 2025 |
30.47 (-1.3%) |
30.94 |
30.39 - 31.17 |
0.3994 times |
Weekly price and charts CentralGarden Strong weekly Stock price targets for CentralGarden CENT are 32.77 and 33.96 | Weekly Target 1 | 32.51 | | Weekly Target 2 | 33.02 | | Weekly Target 3 | 33.696666666667 | | Weekly Target 4 | 34.21 | | Weekly Target 5 | 34.89 |
Weekly price and volumes for Central Garden
| Date |
Closing |
Open |
Range |
Volume |
Thu 04 December 2025 |
33.54 (-1.81%) |
33.89 |
33.18 - 34.37 |
1.0708 times |
Fri 28 November 2025 |
34.16 (5.79%) |
32.11 |
30.80 - 35.93 |
1.8897 times |
Fri 21 November 2025 |
32.29 (1.89%) |
31.68 |
30.39 - 32.36 |
0.9607 times |
Fri 14 November 2025 |
31.69 (0.86%) |
31.64 |
31.24 - 32.21 |
0.8585 times |
Fri 07 November 2025 |
31.42 (2.45%) |
30.88 |
30.62 - 31.77 |
0.9487 times |
Fri 31 October 2025 |
30.67 (0%) |
31.04 |
30.60 - 31.08 |
0.1946 times |
Fri 31 October 2025 |
30.67 (-4.19%) |
32.08 |
30.60 - 32.60 |
0.9924 times |
Fri 24 October 2025 |
32.01 (4.78%) |
30.73 |
30.36 - 32.03 |
1.1876 times |
Fri 17 October 2025 |
30.55 (3.28%) |
29.74 |
28.77 - 30.71 |
1.0217 times |
Fri 10 October 2025 |
29.58 (-7.91%) |
32.20 |
29.53 - 32.20 |
0.8754 times |
Fri 03 October 2025 |
32.12 (-3.34%) |
33.37 |
31.88 - 33.37 |
0.9152 times |
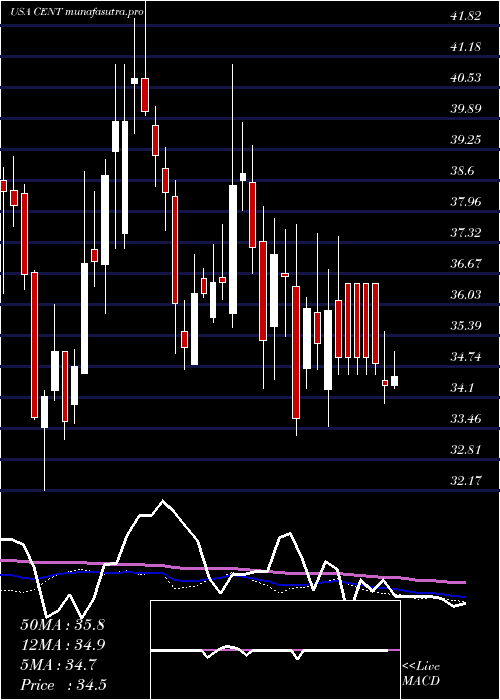
Monthly price and charts CentralGarden Strong monthly Stock price targets for CentralGarden CENT are 32.77 and 33.96 | Monthly Target 1 | 32.51 | | Monthly Target 2 | 33.02 | | Monthly Target 3 | 33.696666666667 | | Monthly Target 4 | 34.21 | | Monthly Target 5 | 34.89 |
Monthly price and volumes Central Garden
| Date |
Closing |
Open |
Range |
Volume |
Thu 04 December 2025 |
33.54 (-1.81%) |
33.89 |
33.18 - 34.37 |
0.1562 times |
Fri 28 November 2025 |
34.16 (11.38%) |
30.88 |
30.39 - 35.93 |
0.6795 times |
Fri 31 October 2025 |
30.67 (-6.06%) |
32.66 |
28.77 - 32.86 |
0.7006 times |
Tue 30 September 2025 |
32.65 (-10.38%) |
36.13 |
32.09 - 38.34 |
0.8304 times |
Fri 29 August 2025 |
36.43 (-6.64%) |
38.99 |
33.38 - 40.48 |
0.6241 times |
Thu 31 July 2025 |
39.02 (10.92%) |
35.08 |
35.08 - 41.25 |
0.6504 times |
Mon 30 June 2025 |
35.18 (-2.44%) |
35.93 |
34.06 - 36.80 |
0.8373 times |
Fri 30 May 2025 |
36.06 (7.45%) |
33.43 |
31.97 - 36.90 |
1.0147 times |
Wed 30 April 2025 |
33.56 (-8.46%) |
36.83 |
32.16 - 37.51 |
1.3815 times |
Mon 31 March 2025 |
36.66 (3.88%) |
35.57 |
33.32 - 37.82 |
3.1252 times |
Fri 28 February 2025 |
35.29 (-3.29%) |
35.85 |
34.29 - 41.01 |
1.2011 times |

DMA SMA EMA moving averages of Central Garden CENT
DMA (daily moving average) of Central Garden CENT
| DMA period | DMA value | | 5 day DMA | 33.79 | | 12 day DMA | 32.76 | | 20 day DMA | 32.28 | | 35 day DMA | 31.81 | | 50 day DMA | 31.64 | | 100 day DMA | 34.35 | | 150 day DMA | 34.83 | | 200 day DMA | 35.04 | EMA (exponential moving average) of Central Garden CENT
| EMA period | EMA current | EMA prev | EMA prev2 | | 5 day EMA | 33.61 | 33.65 | 33.52 | | 12 day EMA | 33.06 | 32.97 | 32.8 | | 20 day EMA | 32.63 | 32.53 | 32.39 | | 35 day EMA | 32.31 | 32.24 | 32.14 | | 50 day EMA | 32.09 | 32.03 | 31.95 |
SMA (simple moving average) of Central Garden CENT
| SMA period | SMA current | SMA prev | SMA prev2 | | 5 day SMA | 33.79 | 33.92 | 33.97 | | 12 day SMA | 32.76 | 32.56 | 32.37 | | 20 day SMA | 32.28 | 32.17 | 32.01 | | 35 day SMA | 31.81 | 31.69 | 31.57 | | 50 day SMA | 31.64 | 31.65 | 31.64 | | 100 day SMA | 34.35 | 34.4 | 34.47 | | 150 day SMA | 34.83 | 34.83 | 34.83 | | 200 day SMA | 35.04 | 35.06 | 35.09 |
|
|
