CelcuityInc CELC full analysis,charts,indicators,moving averages,SMA,DMA,EMA,ADX,MACD,RSICelcuity Inc CELC WideScreen charts, DMA,SMA,EMA technical analysis, forecast prediction, by indicators ADX,MACD,RSI,CCI USA stock exchange
operates under Health Care sector & deals in Medical Specialities
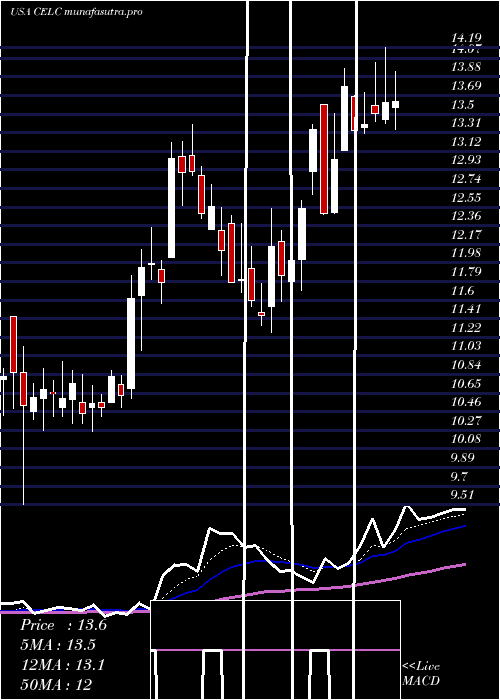
Daily price and charts and targets CelcuityInc Strong Daily Stock price targets for CelcuityInc CELC are 102.31 and 110.92 | Daily Target 1 | 95.38 | | Daily Target 2 | 100.62 | | Daily Target 3 | 103.98666666667 | | Daily Target 4 | 109.23 | | Daily Target 5 | 112.6 |
Daily price and volume Celcuity Inc
| Date |
Closing |
Open |
Range |
Volume |
Thu 04 December 2025 |
105.87 (5.87%) |
99.33 |
98.74 - 107.35 |
0.9238 times |
Wed 03 December 2025 |
100.00 (2.56%) |
98.33 |
97.50 - 101.71 |
0.8668 times |
Tue 02 December 2025 |
97.50 (-1.01%) |
100.00 |
96.92 - 100.29 |
0.7928 times |
Mon 01 December 2025 |
98.49 (-2.62%) |
99.86 |
96.70 - 102.58 |
1.2971 times |
Fri 28 November 2025 |
101.14 (0.79%) |
100.95 |
99.33 - 101.76 |
0.214 times |
Wed 26 November 2025 |
100.35 (1.28%) |
100.00 |
97.74 - 101.36 |
1.0048 times |
Tue 25 November 2025 |
99.08 (-2.05%) |
101.41 |
97.70 - 103.06 |
1.0975 times |
Mon 24 November 2025 |
101.15 (3.74%) |
97.68 |
96.65 - 102.44 |
1.3924 times |
Fri 21 November 2025 |
97.50 (3.72%) |
92.89 |
92.10 - 101.03 |
1.5235 times |
Thu 20 November 2025 |
94.00 (-0.24%) |
94.86 |
92.85 - 98.43 |
0.8872 times |
Wed 19 November 2025 |
94.23 (2.86%) |
92.21 |
91.41 - 94.70 |
0.8862 times |
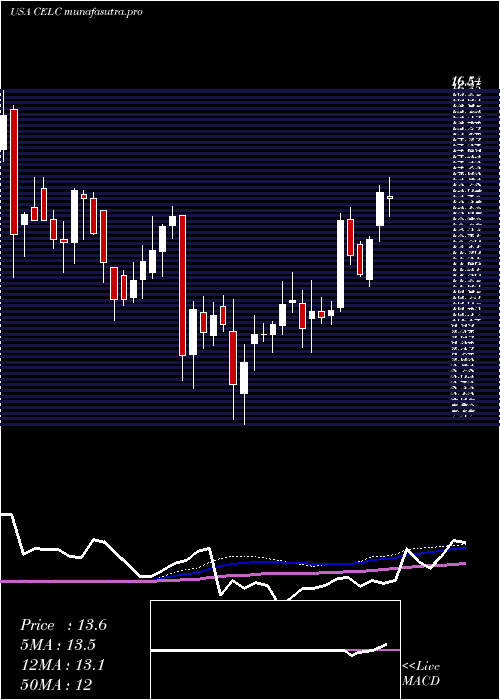
Weekly price and charts CelcuityInc Strong weekly Stock price targets for CelcuityInc CELC are 101.29 and 111.94 | Weekly Target 1 | 92.66 | | Weekly Target 2 | 99.26 | | Weekly Target 3 | 103.30666666667 | | Weekly Target 4 | 109.91 | | Weekly Target 5 | 113.96 |
Weekly price and volumes for Celcuity Inc
| Date |
Closing |
Open |
Range |
Volume |
Thu 04 December 2025 |
105.87 (4.68%) |
99.86 |
96.70 - 107.35 |
0.7284 times |
Fri 28 November 2025 |
101.14 (3.73%) |
97.68 |
96.65 - 103.06 |
0.6962 times |
Fri 21 November 2025 |
97.50 (5.2%) |
90.40 |
86.56 - 101.03 |
1.1548 times |
Fri 14 November 2025 |
92.68 (24.37%) |
75.88 |
74.01 - 94.06 |
0.947 times |
Fri 07 November 2025 |
74.52 (-3.42%) |
72.83 |
71.06 - 75.43 |
0.5771 times |
Fri 31 October 2025 |
77.16 (0%) |
79.03 |
76.43 - 79.97 |
0.2245 times |
Fri 31 October 2025 |
77.16 (8.72%) |
72.47 |
71.50 - 80.13 |
1.098 times |
Fri 24 October 2025 |
70.97 (47.55%) |
54.00 |
54.00 - 116.68 |
2.0503 times |
Fri 17 October 2025 |
48.10 (4.41%) |
46.85 |
45.03 - 54.95 |
1.4347 times |
Fri 10 October 2025 |
46.07 (-8.79%) |
50.51 |
45.85 - 50.63 |
1.089 times |
Fri 03 October 2025 |
50.51 (-0.18%) |
51.07 |
44.42 - 52.76 |
1.3461 times |
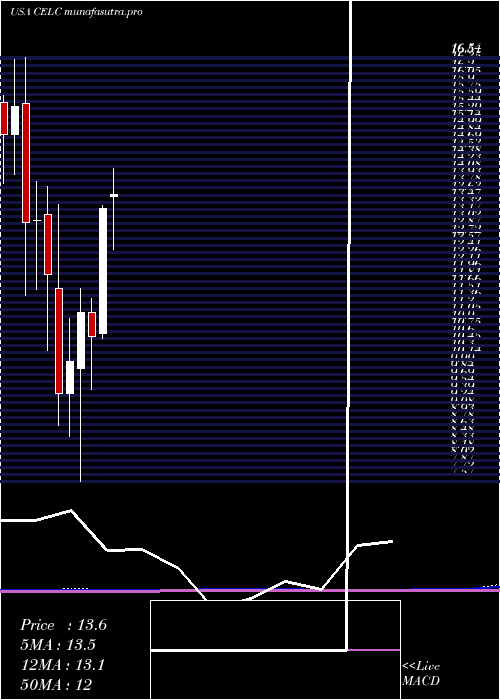
Monthly price and charts CelcuityInc Strong monthly Stock price targets for CelcuityInc CELC are 101.29 and 111.94 | Monthly Target 1 | 92.66 | | Monthly Target 2 | 99.26 | | Monthly Target 3 | 103.30666666667 | | Monthly Target 4 | 109.91 | | Monthly Target 5 | 113.96 |
Monthly price and volumes Celcuity Inc
| Date |
Closing |
Open |
Range |
Volume |
Thu 04 December 2025 |
105.87 (4.68%) |
99.86 |
96.70 - 107.35 |
0.212 times |
Fri 28 November 2025 |
101.14 (31.08%) |
72.83 |
71.06 - 103.06 |
0.9823 times |
Fri 31 October 2025 |
77.16 (56.19%) |
49.08 |
44.42 - 116.68 |
1.9841 times |
Tue 30 September 2025 |
49.40 (-3.57%) |
50.69 |
48.60 - 63.06 |
1.1381 times |
Fri 29 August 2025 |
51.23 (30.79%) |
38.45 |
38.00 - 55.44 |
1.4119 times |
Thu 31 July 2025 |
39.17 (193.41%) |
13.60 |
12.48 - 46.42 |
3.0149 times |
Mon 30 June 2025 |
13.35 (25.59%) |
10.70 |
10.60 - 13.40 |
0.2389 times |
Fri 30 May 2025 |
10.63 (-4.58%) |
11.15 |
9.51 - 11.43 |
0.2131 times |
Wed 30 April 2025 |
11.14 (10.19%) |
9.96 |
7.57 - 11.66 |
0.465 times |
Mon 31 March 2025 |
10.11 (7.21%) |
9.44 |
8.53 - 11.02 |
0.3397 times |
Fri 28 February 2025 |
9.43 (-21.09%) |
11.65 |
8.75 - 13.43 |
0.2638 times |
DMA SMA EMA moving averages of Celcuity Inc CELC
DMA (daily moving average) of Celcuity Inc CELC
| DMA period | DMA value | | 5 day DMA | 100.6 | | 12 day DMA | 98.41 | | 20 day DMA | 92.08 | | 35 day DMA | 82.76 | | 50 day DMA | 72.63 | | 100 day DMA | 58.63 | | 150 day DMA | 43.01 | | 200 day DMA | 34.84 | EMA (exponential moving average) of Celcuity Inc CELC
| EMA period | EMA current | EMA prev | EMA prev2 | | 5 day EMA | 101.28 | 98.98 | 98.47 | | 12 day EMA | 97.44 | 95.91 | 95.17 | | 20 day EMA | 92.55 | 91.15 | 90.22 | | 35 day EMA | 83.28 | 81.95 | 80.89 | | 50 day EMA | 73.83 | 72.52 | 71.4 |
SMA (simple moving average) of Celcuity Inc CELC
| SMA period | SMA current | SMA prev | SMA prev2 | | 5 day SMA | 100.6 | 99.5 | 99.31 | | 12 day SMA | 98.41 | 97.27 | 96.66 | | 20 day SMA | 92.08 | 90.51 | 89.16 | | 35 day SMA | 82.76 | 81.17 | 79.63 | | 50 day SMA | 72.63 | 71.59 | 70.64 | | 100 day SMA | 58.63 | 57.71 | 56.85 | | 150 day SMA | 43.01 | 42.38 | 41.79 | | 200 day SMA | 34.84 | 34.38 | 33.94 |
|
|
