CentralAnd CEE full analysis,charts,indicators,moving averages,SMA,DMA,EMA,ADX,MACD,RSICentral And CEE WideScreen charts, DMA,SMA,EMA technical analysis, forecast prediction, by indicators ADX,MACD,RSI,CCI USA stock exchange
operates under N A sector & deals in N A
Daily price and charts and targets CentralAnd Strong Daily Stock price targets for CentralAnd CEE are 16.36 and 16.62 | Daily Target 1 | 16.3 | | Daily Target 2 | 16.41 | | Daily Target 3 | 16.56 | | Daily Target 4 | 16.67 | | Daily Target 5 | 16.82 |
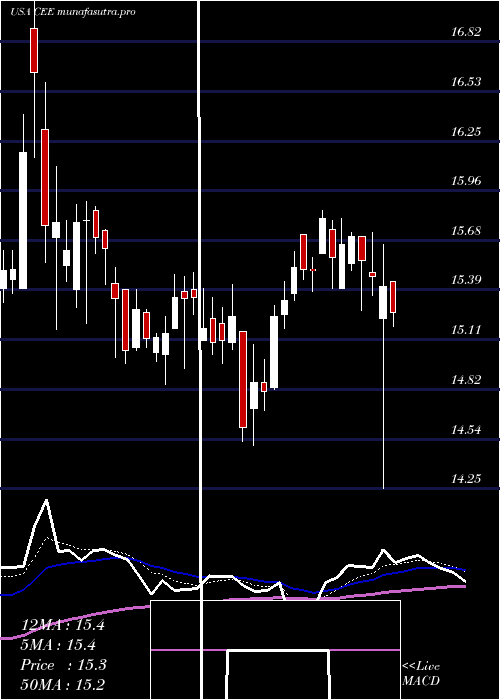
Daily price and volume Central And
| Date |
Closing |
Open |
Range |
Volume |
Thu 04 December 2025 |
16.52 (-0.9%) |
16.58 |
16.45 - 16.71 |
0.3372 times |
Wed 03 December 2025 |
16.67 (-0.54%) |
16.72 |
16.62 - 16.77 |
0.7982 times |
Tue 02 December 2025 |
16.76 (0.6%) |
16.73 |
16.62 - 16.91 |
0.6852 times |
Mon 01 December 2025 |
16.66 (1.09%) |
16.70 |
16.49 - 16.82 |
1.3309 times |
Fri 28 November 2025 |
16.48 (-1.85%) |
16.20 |
16.19 - 16.63 |
0.73 times |
Wed 26 November 2025 |
16.79 (-0.06%) |
16.85 |
16.65 - 17.00 |
1.0762 times |
Tue 25 November 2025 |
16.80 (3.32%) |
16.88 |
16.50 - 16.95 |
1.826 times |
Mon 24 November 2025 |
16.26 (3.17%) |
16.09 |
16.00 - 16.26 |
1.2771 times |
Fri 21 November 2025 |
15.76 (3.96%) |
15.46 |
15.20 - 15.83 |
1.5103 times |
Thu 20 November 2025 |
15.16 (0.53%) |
15.25 |
15.07 - 15.30 |
0.4287 times |
Wed 19 November 2025 |
15.08 (0.53%) |
15.12 |
14.92 - 15.32 |
1.4637 times |
Weekly price and charts CentralAnd Strong weekly Stock price targets for CentralAnd CEE are 16.26 and 16.72 | Weekly Target 1 | 16.17 | | Weekly Target 2 | 16.34 | | Weekly Target 3 | 16.626666666667 | | Weekly Target 4 | 16.8 | | Weekly Target 5 | 17.09 |
Weekly price and volumes for Central And
| Date |
Closing |
Open |
Range |
Volume |
Thu 04 December 2025 |
16.52 (0.24%) |
16.70 |
16.45 - 16.91 |
1.3564 times |
Fri 28 November 2025 |
16.48 (4.57%) |
16.09 |
16.00 - 17.00 |
2.113 times |
Fri 21 November 2025 |
15.76 (2.34%) |
15.36 |
14.82 - 15.83 |
1.8335 times |
Fri 14 November 2025 |
15.40 (-1.53%) |
15.69 |
15.08 - 15.96 |
0.5435 times |
Fri 07 November 2025 |
15.64 (-0.06%) |
15.34 |
15.17 - 15.78 |
0.2756 times |
Fri 31 October 2025 |
15.65 (0%) |
15.77 |
15.60 - 15.77 |
0.0872 times |
Fri 31 October 2025 |
15.65 (0.64%) |
15.62 |
14.99 - 15.93 |
0.6971 times |
Fri 24 October 2025 |
15.55 (-1.02%) |
16.07 |
15.41 - 16.07 |
0.5767 times |
Fri 17 October 2025 |
15.71 (4.94%) |
15.07 |
14.91 - 15.80 |
1.0252 times |
Fri 10 October 2025 |
14.97 (-4.41%) |
15.66 |
14.76 - 15.88 |
1.4916 times |
Fri 03 October 2025 |
15.66 (1.03%) |
15.31 |
15.17 - 15.84 |
0.5529 times |
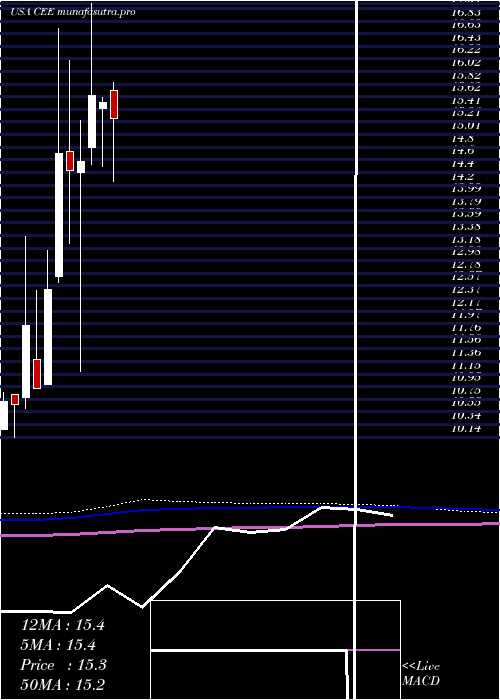
Monthly price and charts CentralAnd Strong monthly Stock price targets for CentralAnd CEE are 16.26 and 16.72 | Monthly Target 1 | 16.17 | | Monthly Target 2 | 16.34 | | Monthly Target 3 | 16.626666666667 | | Monthly Target 4 | 16.8 | | Monthly Target 5 | 17.09 |
Monthly price and volumes Central And
| Date |
Closing |
Open |
Range |
Volume |
Thu 04 December 2025 |
16.52 (0.24%) |
16.70 |
16.45 - 16.91 |
0.1985 times |
Fri 28 November 2025 |
16.48 (5.3%) |
15.34 |
14.82 - 17.00 |
0.6973 times |
Fri 31 October 2025 |
15.65 (1.89%) |
15.46 |
14.76 - 16.07 |
0.6234 times |
Tue 30 September 2025 |
15.36 (-5.94%) |
16.00 |
15.00 - 16.66 |
0.7093 times |
Fri 29 August 2025 |
16.33 (6.94%) |
15.06 |
14.94 - 18.69 |
1.4512 times |
Thu 31 July 2025 |
15.27 (-1.61%) |
15.71 |
14.25 - 15.98 |
0.6054 times |
Mon 30 June 2025 |
15.52 (-0.7%) |
15.43 |
14.50 - 15.61 |
1.1548 times |
Fri 30 May 2025 |
15.63 (7.2%) |
14.80 |
14.53 - 17.11 |
0.8989 times |
Wed 30 April 2025 |
14.58 (1.04%) |
14.40 |
11.20 - 15.23 |
1.4123 times |
Mon 31 March 2025 |
14.43 (-1.84%) |
14.73 |
13.26 - 16.20 |
2.2489 times |
Fri 28 February 2025 |
14.70 (17.51%) |
12.73 |
12.62 - 16.71 |
2.4466 times |
DMA SMA EMA moving averages of Central And CEE
DMA (daily moving average) of Central And CEE
| DMA period | DMA value | | 5 day DMA | 16.62 | | 12 day DMA | 16.16 | | 20 day DMA | 15.93 | | 35 day DMA | 15.81 | | 50 day DMA | 15.68 | | 100 day DMA | 15.93 | | 150 day DMA | 15.73 | | 200 day DMA | 15.36 | EMA (exponential moving average) of Central And CEE
| EMA period | EMA current | EMA prev | EMA prev2 | | 5 day EMA | 16.57 | 16.6 | 16.56 | | 12 day EMA | 16.3 | 16.26 | 16.18 | | 20 day EMA | 16.11 | 16.07 | 16.01 | | 35 day EMA | 15.9 | 15.86 | 15.81 | | 50 day EMA | 15.75 | 15.72 | 15.68 |
SMA (simple moving average) of Central And CEE
| SMA period | SMA current | SMA prev | SMA prev2 | | 5 day SMA | 16.62 | 16.67 | 16.7 | | 12 day SMA | 16.16 | 16.04 | 15.93 | | 20 day SMA | 15.93 | 15.88 | 15.82 | | 35 day SMA | 15.81 | 15.77 | 15.73 | | 50 day SMA | 15.68 | 15.65 | 15.62 | | 100 day SMA | 15.93 | 15.91 | 15.9 | | 150 day SMA | 15.73 | 15.72 | 15.71 | | 200 day SMA | 15.36 | 15.35 | 15.35 |
|
|
