CaredxInc CDNA full analysis,charts,indicators,moving averages,SMA,DMA,EMA,ADX,MACD,RSICaredx Inc CDNA WideScreen charts, DMA,SMA,EMA technical analysis, forecast prediction, by indicators ADX,MACD,RSI,CCI USA stock exchange
operates under Health Care sector & deals in Medical Specialities
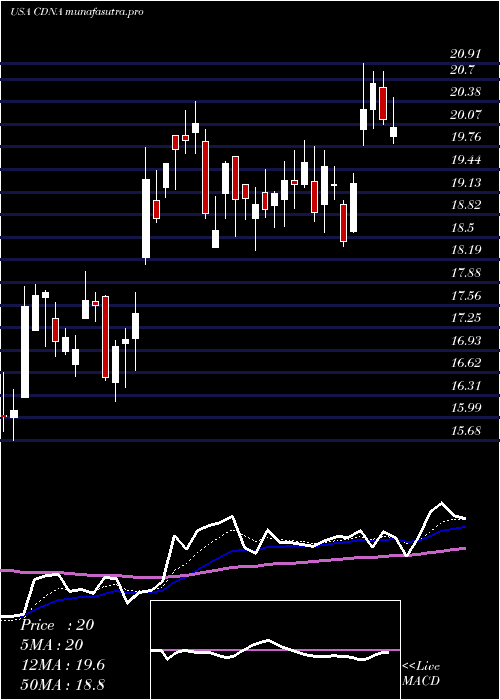
Daily price and charts and targets CaredxInc Strong Daily Stock price targets for CaredxInc CDNA are 14.95 and 15.57 | Daily Target 1 | 14.45 | | Daily Target 2 | 14.83 | | Daily Target 3 | 15.066666666667 | | Daily Target 4 | 15.45 | | Daily Target 5 | 15.69 |
Daily price and volume Caredx Inc
| Date |
Closing |
Open |
Range |
Volume |
Mon 20 October 2025 |
15.22 (5.62%) |
14.70 |
14.68 - 15.30 |
0.9095 times |
Fri 17 October 2025 |
14.41 (-3.87%) |
14.82 |
14.33 - 15.01 |
1.1068 times |
Thu 16 October 2025 |
14.99 (1.97%) |
14.80 |
14.70 - 15.42 |
1.1227 times |
Wed 15 October 2025 |
14.70 (2.44%) |
14.35 |
14.33 - 14.92 |
1.2198 times |
Tue 14 October 2025 |
14.35 (-1.24%) |
14.17 |
14.17 - 14.78 |
0.7707 times |
Mon 13 October 2025 |
14.53 (0.97%) |
14.61 |
14.34 - 14.89 |
0.8866 times |
Fri 10 October 2025 |
14.39 (-2.31%) |
14.78 |
13.95 - 14.93 |
1.1437 times |
Thu 09 October 2025 |
14.73 (-0.41%) |
14.77 |
14.61 - 15.04 |
0.7754 times |
Wed 08 October 2025 |
14.79 (0.82%) |
14.78 |
14.69 - 15.10 |
0.942 times |
Tue 07 October 2025 |
14.67 (-2.13%) |
15.10 |
14.64 - 15.10 |
1.1229 times |
Mon 06 October 2025 |
14.99 (-1.19%) |
15.20 |
14.94 - 15.50 |
1.0277 times |
Weekly price and charts CaredxInc Strong weekly Stock price targets for CaredxInc CDNA are 14.95 and 15.57 | Weekly Target 1 | 14.45 | | Weekly Target 2 | 14.83 | | Weekly Target 3 | 15.066666666667 | | Weekly Target 4 | 15.45 | | Weekly Target 5 | 15.69 |
Weekly price and volumes for Caredx Inc
| Date |
Closing |
Open |
Range |
Volume |
Mon 20 October 2025 |
15.22 (5.62%) |
14.70 |
14.68 - 15.30 |
0.1708 times |
Fri 17 October 2025 |
14.41 (0.14%) |
14.61 |
14.17 - 15.42 |
0.9591 times |
Fri 10 October 2025 |
14.39 (-5.14%) |
15.20 |
13.95 - 15.50 |
0.9413 times |
Fri 03 October 2025 |
15.17 (1.61%) |
14.98 |
14.28 - 15.50 |
0.9349 times |
Fri 26 September 2025 |
14.93 (2.33%) |
14.63 |
14.51 - 15.75 |
1.2744 times |
Fri 19 September 2025 |
14.59 (7.83%) |
13.55 |
13.39 - 14.95 |
1.4024 times |
Fri 12 September 2025 |
13.53 (-2.1%) |
13.80 |
13.12 - 14.00 |
1.0017 times |
Fri 05 September 2025 |
13.82 (1.17%) |
13.48 |
12.37 - 14.20 |
1.412 times |
Fri 29 August 2025 |
13.66 (0%) |
13.17 |
13.06 - 13.77 |
0.3603 times |
Fri 29 August 2025 |
13.66 (5.32%) |
12.90 |
12.45 - 13.77 |
1.5431 times |
Fri 22 August 2025 |
12.97 (9.54%) |
11.88 |
11.27 - 13.05 |
1.0994 times |
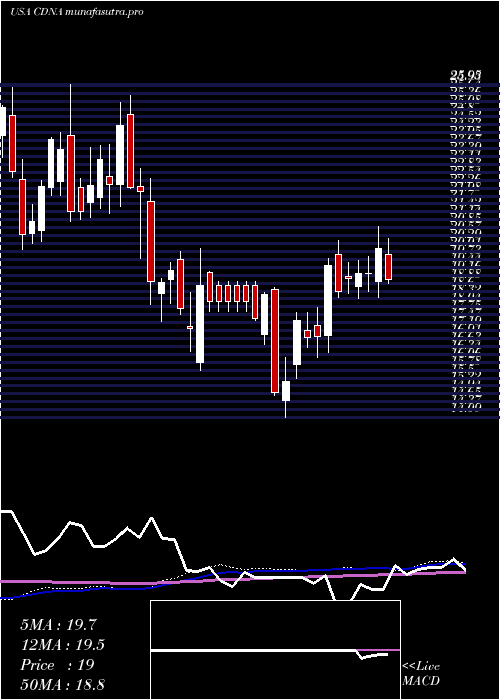
Monthly price and charts CaredxInc Strong monthly Stock price targets for CaredxInc CDNA are 14.59 and 16.14 | Monthly Target 1 | 13.34 | | Monthly Target 2 | 14.28 | | Monthly Target 3 | 14.89 | | Monthly Target 4 | 15.83 | | Monthly Target 5 | 16.44 |
Monthly price and volumes Caredx Inc
| Date |
Closing |
Open |
Range |
Volume |
Mon 20 October 2025 |
15.22 (4.68%) |
14.60 |
13.95 - 15.50 |
0.5981 times |
Tue 30 September 2025 |
14.54 (6.44%) |
13.48 |
12.37 - 15.75 |
1.3025 times |
Fri 29 August 2025 |
13.66 (11.15%) |
12.09 |
11.26 - 13.77 |
1.32 times |
Thu 31 July 2025 |
12.29 (-37.1%) |
19.28 |
10.96 - 20.91 |
1.9079 times |
Mon 30 June 2025 |
19.54 (15.01%) |
17.03 |
16.41 - 20.39 |
0.8102 times |
Fri 30 May 2025 |
16.99 (0.65%) |
16.31 |
14.09 - 18.02 |
1.3169 times |
Wed 30 April 2025 |
16.88 (-4.9%) |
17.63 |
15.78 - 20.13 |
0.6527 times |
Mon 31 March 2025 |
17.75 (-19.86%) |
21.78 |
17.05 - 22.61 |
0.5438 times |
Fri 28 February 2025 |
22.15 (-4.94%) |
22.68 |
19.75 - 25.55 |
0.7896 times |
Fri 31 January 2025 |
23.30 (8.83%) |
21.65 |
21.09 - 25.95 |
0.7583 times |
Tue 31 December 2024 |
21.41 (-14.77%) |
24.85 |
20.09 - 25.84 |
0.4821 times |
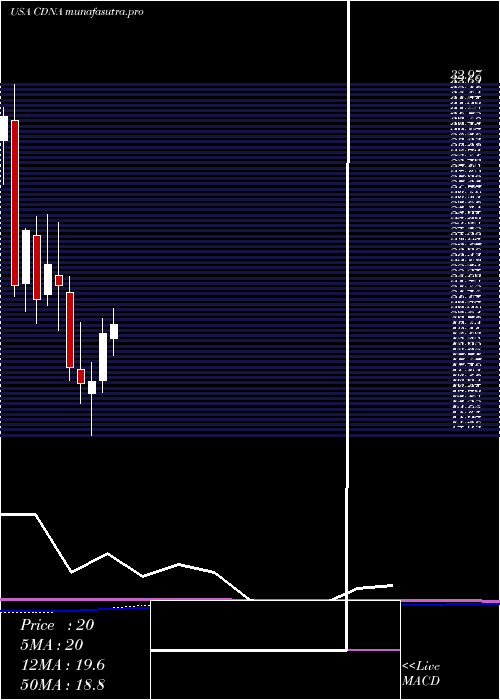
DMA SMA EMA moving averages of Caredx Inc CDNA
DMA (daily moving average) of Caredx Inc CDNA
| DMA period | DMA value | | 5 day DMA | 14.73 | | 12 day DMA | 14.75 | | 20 day DMA | 14.83 | | 35 day DMA | 14.4 | | 50 day DMA | 13.86 | | 100 day DMA | 15.33 | | 150 day DMA | 16.05 | | 200 day DMA | 17.57 | EMA (exponential moving average) of Caredx Inc CDNA
| EMA period | EMA current | EMA prev | EMA prev2 | | 5 day EMA | 14.82 | 14.62 | 14.72 | | 12 day EMA | 14.74 | 14.65 | 14.69 | | 20 day EMA | 14.63 | 14.57 | 14.59 | | 35 day EMA | 14.25 | 14.19 | 14.18 | | 50 day EMA | 13.83 | 13.77 | 13.74 |
SMA (simple moving average) of Caredx Inc CDNA
| SMA period | SMA current | SMA prev | SMA prev2 | | 5 day SMA | 14.73 | 14.6 | 14.59 | | 12 day SMA | 14.75 | 14.72 | 14.76 | | 20 day SMA | 14.83 | 14.82 | 14.83 | | 35 day SMA | 14.4 | 14.36 | 14.34 | | 50 day SMA | 13.86 | 13.79 | 13.74 | | 100 day SMA | 15.33 | 15.35 | 15.38 | | 150 day SMA | 16.05 | 16.08 | 16.11 | | 200 day SMA | 17.57 | 17.61 | 17.64 |
|
|
