VictorysharesUs CDC full analysis,charts,indicators,moving averages,SMA,DMA,EMA,ADX,MACD,RSIVictoryshares Us CDC WideScreen charts, DMA,SMA,EMA technical analysis, forecast prediction, by indicators ADX,MACD,RSI,CCI USA stock exchange
operates under N A sector & deals in N A
Daily price and charts and targets VictorysharesUs Strong Daily Stock price targets for VictorysharesUs CDC are 66.15 and 66.52 | Daily Target 1 | 66.07 | | Daily Target 2 | 66.22 | | Daily Target 3 | 66.436666666667 | | Daily Target 4 | 66.59 | | Daily Target 5 | 66.81 |
Daily price and volume Victoryshares Us
| Date |
Closing |
Open |
Range |
Volume |
Thu 04 December 2025 |
66.38 (-0.2%) |
66.50 |
66.28 - 66.65 |
0.9321 times |
Wed 03 December 2025 |
66.51 (0.56%) |
66.24 |
66.24 - 66.62 |
0.7354 times |
Tue 02 December 2025 |
66.14 (-0.6%) |
66.54 |
65.96 - 66.54 |
1.2131 times |
Mon 01 December 2025 |
66.54 (-1.03%) |
66.78 |
66.54 - 67.10 |
0.8009 times |
Fri 28 November 2025 |
67.23 (0.6%) |
66.71 |
66.71 - 67.23 |
1.0304 times |
Wed 26 November 2025 |
66.83 (0.75%) |
66.33 |
66.33 - 66.98 |
1.2178 times |
Tue 25 November 2025 |
66.33 (0.85%) |
65.98 |
65.98 - 66.36 |
1.8595 times |
Mon 24 November 2025 |
65.77 (-0.05%) |
65.82 |
65.48 - 65.96 |
0.9368 times |
Fri 21 November 2025 |
65.80 (1.53%) |
65.10 |
65.09 - 66.16 |
0.8852 times |
Thu 20 November 2025 |
64.81 (-0.38%) |
65.20 |
64.80 - 65.60 |
0.3888 times |
Wed 19 November 2025 |
65.06 (-1.08%) |
65.44 |
64.85 - 65.44 |
1.6674 times |
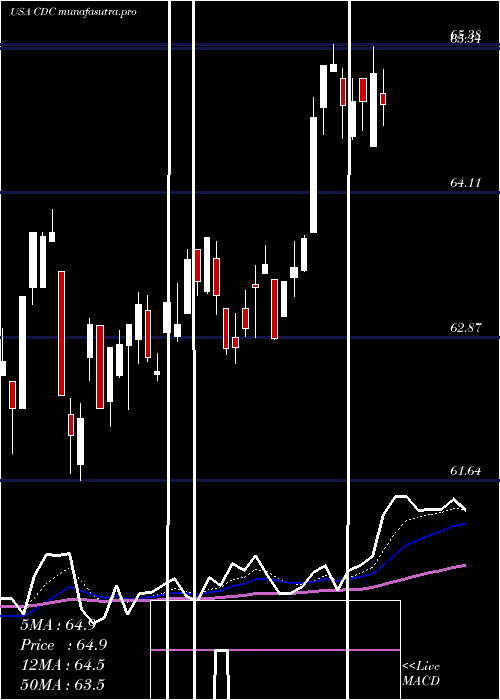
Weekly price and charts VictorysharesUs Strong weekly Stock price targets for VictorysharesUs CDC are 65.6 and 66.74 | Weekly Target 1 | 65.34 | | Weekly Target 2 | 65.86 | | Weekly Target 3 | 66.48 | | Weekly Target 4 | 67 | | Weekly Target 5 | 67.62 |
Weekly price and volumes for Victoryshares Us
| Date |
Closing |
Open |
Range |
Volume |
Thu 04 December 2025 |
66.38 (-1.26%) |
66.78 |
65.96 - 67.10 |
0.8339 times |
Fri 28 November 2025 |
67.23 (2.17%) |
65.82 |
65.48 - 67.23 |
1.1426 times |
Fri 21 November 2025 |
65.80 (-0.26%) |
65.91 |
64.80 - 66.16 |
1.7431 times |
Fri 14 November 2025 |
65.97 (1.06%) |
65.29 |
64.90 - 66.52 |
0.9951 times |
Fri 07 November 2025 |
65.28 (0.08%) |
64.62 |
64.50 - 65.28 |
0.9293 times |
Fri 31 October 2025 |
65.23 (0%) |
65.02 |
64.96 - 65.31 |
0.1782 times |
Fri 31 October 2025 |
65.23 (-1.75%) |
66.51 |
64.96 - 66.58 |
1.1012 times |
Fri 24 October 2025 |
66.39 (0.51%) |
66.34 |
66.12 - 66.80 |
1.028 times |
Fri 17 October 2025 |
66.05 (1.26%) |
65.22 |
65.22 - 66.67 |
0.8413 times |
Fri 10 October 2025 |
65.23 (-2.54%) |
66.95 |
65.21 - 66.98 |
1.2073 times |
Fri 03 October 2025 |
66.93 (0.77%) |
66.51 |
66.10 - 67.13 |
0.7154 times |
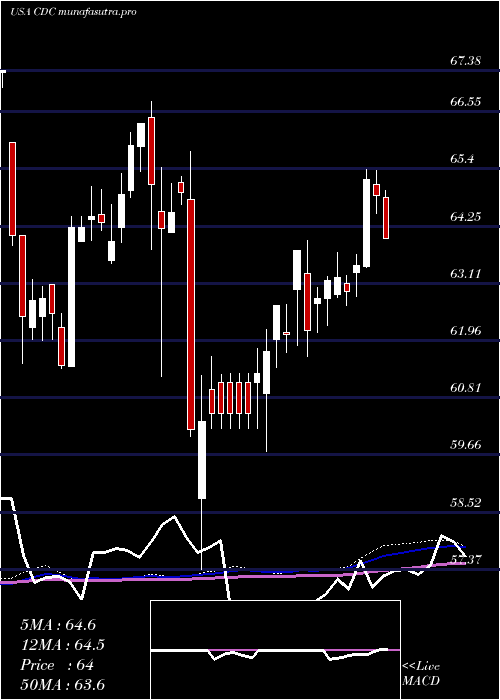
Monthly price and charts VictorysharesUs Strong monthly Stock price targets for VictorysharesUs CDC are 65.6 and 66.74 | Monthly Target 1 | 65.34 | | Monthly Target 2 | 65.86 | | Monthly Target 3 | 66.48 | | Monthly Target 4 | 67 | | Monthly Target 5 | 67.62 |
Monthly price and volumes Victoryshares Us
| Date |
Closing |
Open |
Range |
Volume |
Thu 04 December 2025 |
66.38 (-1.26%) |
66.78 |
65.96 - 67.10 |
0.1717 times |
Fri 28 November 2025 |
67.23 (3.07%) |
64.62 |
64.50 - 67.23 |
0.9906 times |
Fri 31 October 2025 |
65.23 (-2.26%) |
66.69 |
64.96 - 67.13 |
0.9688 times |
Tue 30 September 2025 |
66.74 (0.56%) |
66.03 |
65.10 - 66.74 |
0.8822 times |
Fri 29 August 2025 |
66.37 (2.85%) |
64.26 |
63.99 - 67.04 |
0.7937 times |
Thu 31 July 2025 |
64.53 (1.29%) |
63.77 |
63.77 - 65.82 |
0.9552 times |
Mon 30 June 2025 |
63.71 (1.43%) |
62.80 |
62.25 - 63.74 |
0.9029 times |
Fri 30 May 2025 |
62.81 (0.74%) |
61.94 |
61.64 - 63.96 |
1.3674 times |
Wed 30 April 2025 |
62.35 (-5.13%) |
65.53 |
57.37 - 65.68 |
1.9074 times |
Mon 31 March 2025 |
65.72 (-0.9%) |
66.44 |
61.24 - 66.76 |
1.0601 times |
Fri 28 February 2025 |
66.32 (3.09%) |
63.57 |
63.51 - 66.32 |
1.0266 times |
DMA SMA EMA moving averages of Victoryshares Us CDC
DMA (daily moving average) of Victoryshares Us CDC
| DMA period | DMA value | | 5 day DMA | 66.56 | | 12 day DMA | 66.1 | | 20 day DMA | 65.91 | | 35 day DMA | 65.85 | | 50 day DMA | 66 | | 100 day DMA | 65.8 | | 150 day DMA | 64.95 | | 200 day DMA | 64.5 | EMA (exponential moving average) of Victoryshares Us CDC
| EMA period | EMA current | EMA prev | EMA prev2 | | 5 day EMA | 66.42 | 66.44 | 66.4 | | 12 day EMA | 66.22 | 66.19 | 66.13 | | 20 day EMA | 66.08 | 66.05 | 66 | | 35 day EMA | 66.03 | 66.01 | 65.98 | | 50 day EMA | 66.04 | 66.03 | 66.01 |
SMA (simple moving average) of Victoryshares Us CDC
| SMA period | SMA current | SMA prev | SMA prev2 | | 5 day SMA | 66.56 | 66.65 | 66.61 | | 12 day SMA | 66.1 | 66.02 | 65.97 | | 20 day SMA | 65.91 | 65.84 | 65.75 | | 35 day SMA | 65.85 | 65.85 | 65.84 | | 50 day SMA | 66 | 65.99 | 65.98 | | 100 day SMA | 65.8 | 65.77 | 65.76 | | 150 day SMA | 64.95 | 64.93 | 64.9 | | 200 day SMA | 64.5 | 64.5 | 64.49 |
|
|
