CenturyCommunities CCS full analysis,charts,indicators,moving averages,SMA,DMA,EMA,ADX,MACD,RSICentury Communities CCS WideScreen charts, DMA,SMA,EMA technical analysis, forecast prediction, by indicators ADX,MACD,RSI,CCI USA stock exchange
operates under Capital Goods sector & deals in Homebuilding
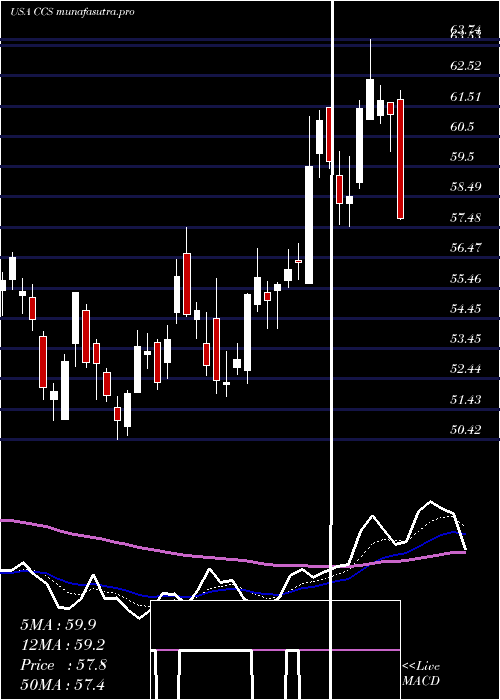
Daily price and charts and targets CenturyCommunities Strong Daily Stock price targets for CenturyCommunities CCS are 59.43 and 63.48 | Daily Target 1 | 56.17 | | Daily Target 2 | 58.64 | | Daily Target 3 | 60.223333333333 | | Daily Target 4 | 62.69 | | Daily Target 5 | 64.27 |
Daily price and volume Century Communities
| Date |
Closing |
Open |
Range |
Volume |
Tue 21 October 2025 |
61.10 (2.04%) |
58.74 |
57.76 - 61.81 |
0.7635 times |
Mon 20 October 2025 |
59.88 (-0.38%) |
60.28 |
59.78 - 61.20 |
0.6126 times |
Fri 17 October 2025 |
60.11 (0.65%) |
59.46 |
59.05 - 60.53 |
0.6189 times |
Thu 16 October 2025 |
59.72 (-1.26%) |
60.48 |
58.84 - 60.64 |
0.8097 times |
Wed 15 October 2025 |
60.48 (-0.35%) |
61.01 |
60.39 - 61.93 |
0.8496 times |
Tue 14 October 2025 |
60.69 (5.07%) |
57.39 |
57.39 - 60.91 |
0.9835 times |
Mon 13 October 2025 |
57.76 (0.05%) |
58.11 |
56.94 - 58.57 |
1.4357 times |
Fri 10 October 2025 |
57.73 (-2.15%) |
59.53 |
57.31 - 59.58 |
1.1999 times |
Thu 09 October 2025 |
59.00 (0.37%) |
58.20 |
57.35 - 59.05 |
1.7008 times |
Wed 08 October 2025 |
58.78 (1.14%) |
58.54 |
56.65 - 58.90 |
1.0258 times |
Tue 07 October 2025 |
58.12 (-6.05%) |
61.31 |
58.02 - 61.37 |
1.7654 times |
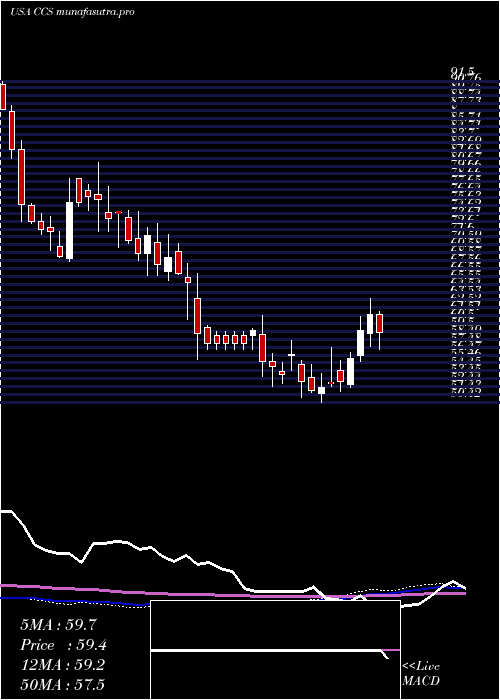
Weekly price and charts CenturyCommunities Strong weekly Stock price targets for CenturyCommunities CCS are 59.43 and 63.48 | Weekly Target 1 | 56.17 | | Weekly Target 2 | 58.64 | | Weekly Target 3 | 60.223333333333 | | Weekly Target 4 | 62.69 | | Weekly Target 5 | 64.27 |
Weekly price and volumes for Century Communities
| Date |
Closing |
Open |
Range |
Volume |
Tue 21 October 2025 |
61.10 (1.65%) |
60.28 |
57.76 - 61.81 |
0.3218 times |
Fri 17 October 2025 |
60.11 (4.12%) |
58.11 |
56.94 - 61.93 |
1.0983 times |
Fri 10 October 2025 |
57.73 (-10.25%) |
64.30 |
56.65 - 64.64 |
1.4603 times |
Fri 03 October 2025 |
64.32 (2.01%) |
63.29 |
62.13 - 65.40 |
0.7983 times |
Fri 26 September 2025 |
63.05 (-4.54%) |
65.26 |
61.80 - 65.50 |
1.3047 times |
Fri 19 September 2025 |
66.05 (-2.09%) |
67.97 |
65.78 - 71.13 |
2.0348 times |
Fri 12 September 2025 |
67.46 (-3.16%) |
69.63 |
66.64 - 69.88 |
0.8452 times |
Fri 05 September 2025 |
69.66 (5.74%) |
64.49 |
63.53 - 71.23 |
0.9724 times |
Fri 29 August 2025 |
65.88 (0%) |
65.79 |
65.10 - 66.16 |
0.2047 times |
Fri 29 August 2025 |
65.88 (-2.33%) |
66.59 |
64.25 - 67.15 |
0.9595 times |
Fri 22 August 2025 |
67.45 (3.06%) |
65.73 |
61.77 - 68.42 |
0.9708 times |
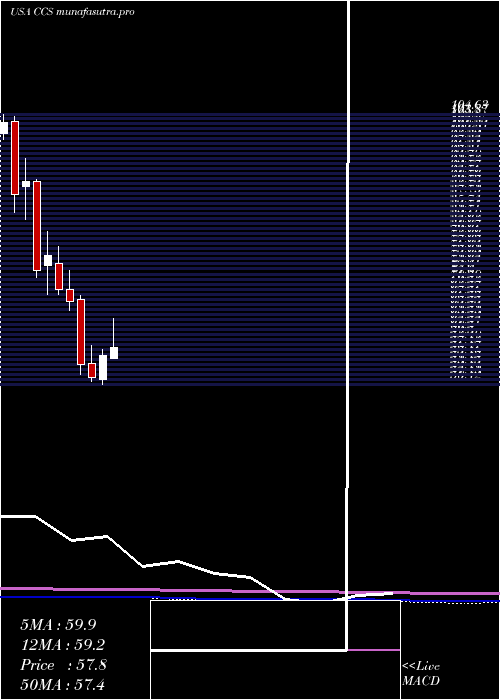
Monthly price and charts CenturyCommunities Strong monthly Stock price targets for CenturyCommunities CCS are 54.5 and 63.25 | Monthly Target 1 | 52.3 | | Monthly Target 2 | 56.7 | | Monthly Target 3 | 61.05 | | Monthly Target 4 | 65.45 | | Monthly Target 5 | 69.8 |
Monthly price and volumes Century Communities
| Date |
Closing |
Open |
Range |
Volume |
Tue 21 October 2025 |
61.10 (-3.58%) |
63.60 |
56.65 - 65.40 |
0.5851 times |
Tue 30 September 2025 |
63.37 (-3.81%) |
64.49 |
61.80 - 71.23 |
0.9638 times |
Fri 29 August 2025 |
65.88 (17.04%) |
57.65 |
56.93 - 68.42 |
0.7694 times |
Thu 31 July 2025 |
56.29 (-0.05%) |
55.61 |
55.61 - 65.19 |
1.0906 times |
Mon 30 June 2025 |
56.32 (8.58%) |
51.50 |
50.42 - 57.48 |
0.884 times |
Fri 30 May 2025 |
51.87 (-4.9%) |
54.65 |
51.07 - 58.31 |
1.059 times |
Wed 30 April 2025 |
54.54 (-18.72%) |
67.50 |
52.41 - 68.25 |
1.1143 times |
Mon 31 March 2025 |
67.10 (-3.36%) |
69.47 |
65.22 - 73.37 |
1.3046 times |
Fri 28 February 2025 |
69.43 (-9.1%) |
74.75 |
68.56 - 78.05 |
1.0644 times |
Fri 31 January 2025 |
76.38 (4.12%) |
74.39 |
68.49 - 81.10 |
1.1646 times |
Tue 31 December 2024 |
73.36 (-19.48%) |
91.15 |
71.95 - 91.50 |
0.7065 times |
DMA SMA EMA moving averages of Century Communities CCS
DMA (daily moving average) of Century Communities CCS
| DMA period | DMA value | | 5 day DMA | 60.26 | | 12 day DMA | 59.6 | | 20 day DMA | 61.13 | | 35 day DMA | 63.7 | | 50 day DMA | 64.21 | | 100 day DMA | 60.81 | | 150 day DMA | 60.09 | | 200 day DMA | 63.31 | EMA (exponential moving average) of Century Communities CCS
| EMA period | EMA current | EMA prev | EMA prev2 | | 5 day EMA | 60.28 | 59.87 | 59.87 | | 12 day EMA | 60.47 | 60.35 | 60.44 | | 20 day EMA | 61.24 | 61.26 | 61.4 | | 35 day EMA | 62.25 | 62.32 | 62.46 | | 50 day EMA | 63.56 | 63.66 | 63.81 |
SMA (simple moving average) of Century Communities CCS
| SMA period | SMA current | SMA prev | SMA prev2 | | 5 day SMA | 60.26 | 60.18 | 59.75 | | 12 day SMA | 59.6 | 59.87 | 60.18 | | 20 day SMA | 61.13 | 61.25 | 61.43 | | 35 day SMA | 63.7 | 63.79 | 63.96 | | 50 day SMA | 64.21 | 64.25 | 64.25 | | 100 day SMA | 60.81 | 60.73 | 60.68 | | 150 day SMA | 60.09 | 60.15 | 60.21 | | 200 day SMA | 63.31 | 63.36 | 63.42 |
|
|
