CarnivalCorporation CCL full analysis,charts,indicators,moving averages,SMA,DMA,EMA,ADX,MACD,RSICarnival Corporation CCL WideScreen charts, DMA,SMA,EMA technical analysis, forecast prediction, by indicators ADX,MACD,RSI,CCI USA stock exchange
operates under Consumer Services sector & deals in Marine Transportation
Daily price and charts and targets CarnivalCorporation Strong Daily Stock price targets for CarnivalCorporation CCL are 28.61 and 29.31 | Daily Target 1 | 28.06 | | Daily Target 2 | 28.46 | | Daily Target 3 | 28.76 | | Daily Target 4 | 29.16 | | Daily Target 5 | 29.46 |
Daily price and volume Carnival Corporation
| Date |
Closing |
Open |
Range |
Volume |
Mon 20 October 2025 |
28.86 (1.76%) |
28.40 |
28.36 - 29.06 |
0.7812 times |
Fri 17 October 2025 |
28.36 (0.5%) |
27.75 |
27.50 - 28.57 |
0.9268 times |
Thu 16 October 2025 |
28.22 (-2.15%) |
28.75 |
28.03 - 29.12 |
0.9771 times |
Wed 15 October 2025 |
28.84 (-0.41%) |
29.13 |
28.73 - 29.40 |
0.8271 times |
Tue 14 October 2025 |
28.96 (3.1%) |
27.64 |
27.47 - 29.27 |
1.1766 times |
Mon 13 October 2025 |
28.09 (1.44%) |
28.21 |
27.87 - 28.52 |
0.8812 times |
Fri 10 October 2025 |
27.69 (-2.67%) |
28.40 |
27.61 - 28.79 |
1.092 times |
Thu 09 October 2025 |
28.45 (-1.63%) |
29.17 |
28.31 - 29.23 |
0.8547 times |
Wed 08 October 2025 |
28.92 (0.73%) |
28.79 |
28.47 - 29.26 |
0.9619 times |
Tue 07 October 2025 |
28.71 (-1.27%) |
29.01 |
27.94 - 29.03 |
1.5213 times |
Mon 06 October 2025 |
29.08 (1.82%) |
28.53 |
28.02 - 29.15 |
1.0821 times |
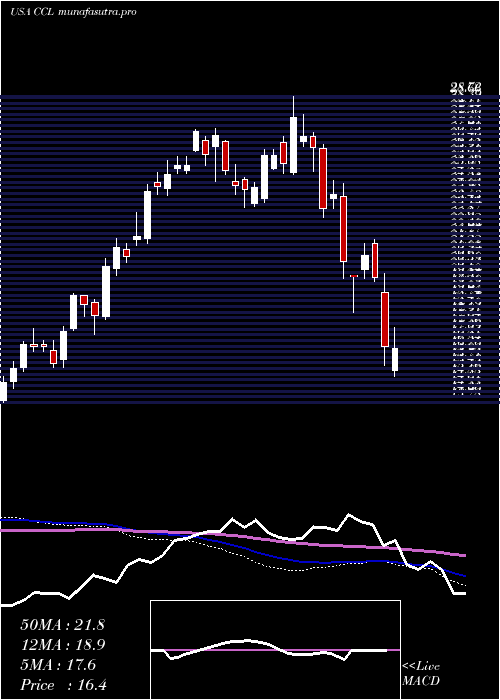
Weekly price and charts CarnivalCorporation Strong weekly Stock price targets for CarnivalCorporation CCL are 28.61 and 29.31 | Weekly Target 1 | 28.06 | | Weekly Target 2 | 28.46 | | Weekly Target 3 | 28.76 | | Weekly Target 4 | 29.16 | | Weekly Target 5 | 29.46 |
Weekly price and volumes for Carnival Corporation
| Date |
Closing |
Open |
Range |
Volume |
Mon 20 October 2025 |
28.86 (1.76%) |
28.40 |
28.36 - 29.06 |
0.1483 times |
Fri 17 October 2025 |
28.36 (2.42%) |
28.21 |
27.47 - 29.40 |
0.9091 times |
Fri 10 October 2025 |
27.69 (-3.05%) |
28.53 |
27.61 - 29.26 |
1.0464 times |
Fri 03 October 2025 |
28.56 (-6.73%) |
32.21 |
28.32 - 32.50 |
2.5079 times |
Fri 26 September 2025 |
30.62 (0.33%) |
30.57 |
29.92 - 31.67 |
1.2174 times |
Fri 19 September 2025 |
30.52 (-3.14%) |
31.52 |
30.28 - 31.72 |
1.3478 times |
Fri 12 September 2025 |
31.51 (-0.19%) |
31.70 |
30.56 - 32.80 |
1.0541 times |
Fri 05 September 2025 |
31.57 (-1%) |
30.70 |
30.54 - 32.24 |
0.6019 times |
Fri 29 August 2025 |
31.89 (0%) |
32.29 |
31.75 - 32.62 |
0.1781 times |
Fri 29 August 2025 |
31.89 (1.88%) |
31.11 |
30.97 - 32.77 |
0.989 times |
Fri 22 August 2025 |
31.30 (5.17%) |
29.60 |
28.65 - 31.38 |
0.9902 times |
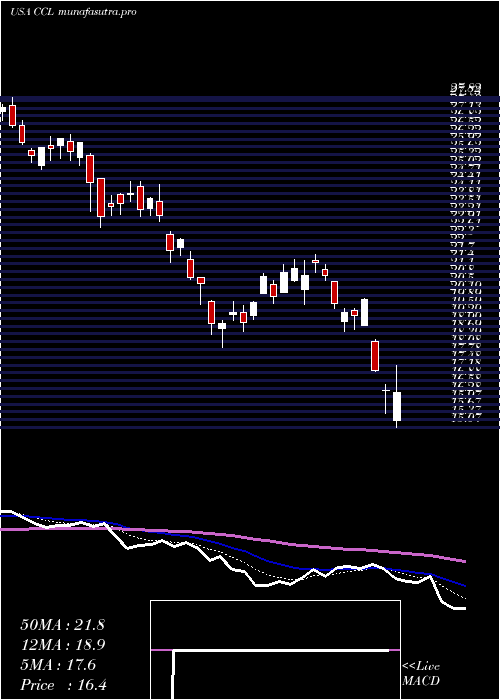
Monthly price and charts CarnivalCorporation Strong monthly Stock price targets for CarnivalCorporation CCL are 27.2 and 29.13 | Monthly Target 1 | 26.65 | | Monthly Target 2 | 27.75 | | Monthly Target 3 | 28.576666666667 | | Monthly Target 4 | 29.68 | | Monthly Target 5 | 30.51 |
Monthly price and volumes Carnival Corporation
| Date |
Closing |
Open |
Range |
Volume |
Mon 20 October 2025 |
28.86 (-0.17%) |
28.88 |
27.47 - 29.40 |
0.5343 times |
Tue 30 September 2025 |
28.91 (-9.34%) |
30.70 |
28.59 - 32.80 |
1.0847 times |
Fri 29 August 2025 |
31.89 (7.12%) |
29.04 |
28.07 - 32.77 |
0.7508 times |
Thu 31 July 2025 |
29.77 (5.87%) |
28.08 |
28.07 - 31.01 |
1.0566 times |
Mon 30 June 2025 |
28.12 (21.1%) |
23.07 |
22.11 - 28.18 |
1.1744 times |
Fri 30 May 2025 |
23.22 (26.61%) |
18.68 |
18.51 - 23.67 |
1.033 times |
Wed 30 April 2025 |
18.34 (-6.09%) |
19.60 |
15.07 - 20.05 |
1.2695 times |
Mon 31 March 2025 |
19.53 (-18.39%) |
23.82 |
18.16 - 24.47 |
1.2668 times |
Fri 28 February 2025 |
23.93 (-13.52%) |
26.52 |
22.82 - 27.82 |
0.7858 times |
Fri 31 January 2025 |
27.67 (11.04%) |
25.13 |
23.27 - 28.72 |
1.044 times |
Tue 31 December 2024 |
24.92 (-1.66%) |
26.09 |
24.31 - 27.14 |
0.71 times |
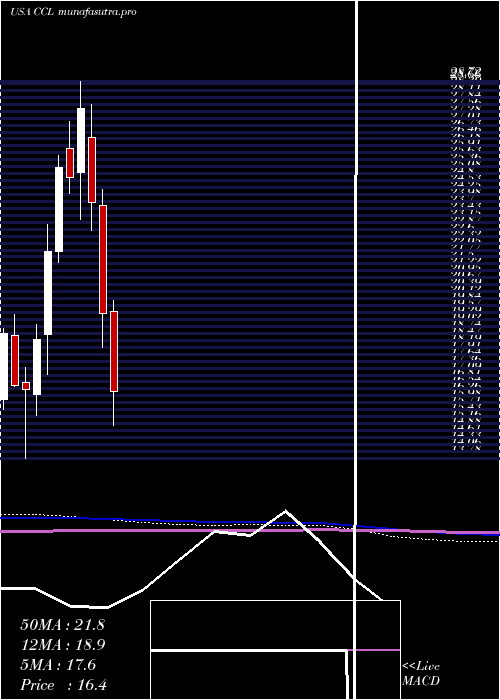
DMA SMA EMA moving averages of Carnival Corporation CCL
DMA (daily moving average) of Carnival Corporation CCL
| DMA period | DMA value | | 5 day DMA | 28.65 | | 12 day DMA | 28.56 | | 20 day DMA | 29.02 | | 35 day DMA | 30.03 | | 50 day DMA | 30.25 | | 100 day DMA | 28.7 | | 150 day DMA | 25.72 | | 200 day DMA | 25.41 | EMA (exponential moving average) of Carnival Corporation CCL
| EMA period | EMA current | EMA prev | EMA prev2 | | 5 day EMA | 28.59 | 28.45 | 28.49 | | 12 day EMA | 28.73 | 28.71 | 28.77 | | 20 day EMA | 29.05 | 29.07 | 29.15 | | 35 day EMA | 29.44 | 29.47 | 29.54 | | 50 day EMA | 29.97 | 30.02 | 30.09 |
SMA (simple moving average) of Carnival Corporation CCL
| SMA period | SMA current | SMA prev | SMA prev2 | | 5 day SMA | 28.65 | 28.49 | 28.36 | | 12 day SMA | 28.56 | 28.56 | 28.56 | | 20 day SMA | 29.02 | 29.11 | 29.22 | | 35 day SMA | 30.03 | 30.12 | 30.22 | | 50 day SMA | 30.25 | 30.24 | 30.24 | | 100 day SMA | 28.7 | 28.64 | 28.58 | | 150 day SMA | 25.72 | 25.67 | 25.6 | | 200 day SMA | 25.41 | 25.39 | 25.38 |
|
|
