CbizInc CBZ full analysis,charts,indicators,moving averages,SMA,DMA,EMA,ADX,MACD,RSICbiz Inc CBZ WideScreen charts, DMA,SMA,EMA technical analysis, forecast prediction, by indicators ADX,MACD,RSI,CCI USA stock exchange
operates under Miscellaneous sector & deals in Business Services
Daily price and charts and targets CbizInc Strong Daily Stock price targets for CbizInc CBZ are 51.39 and 52.36 | Daily Target 1 | 50.59 | | Daily Target 2 | 51.22 | | Daily Target 3 | 51.563333333333 | | Daily Target 4 | 52.19 | | Daily Target 5 | 52.53 |
Daily price and volume Cbiz Inc
| Date |
Closing |
Open |
Range |
Volume |
Mon 20 October 2025 |
51.84 (1.11%) |
51.53 |
50.94 - 51.91 |
0.9976 times |
Fri 17 October 2025 |
51.27 (-1.89%) |
52.05 |
50.78 - 52.44 |
1.2116 times |
Thu 16 October 2025 |
52.26 (-3.54%) |
54.17 |
52.12 - 54.17 |
1.2068 times |
Wed 15 October 2025 |
54.18 (-0.39%) |
54.08 |
53.80 - 55.01 |
1.2341 times |
Tue 14 October 2025 |
54.39 (2.08%) |
53.19 |
53.06 - 55.57 |
1.2332 times |
Mon 13 October 2025 |
53.28 (-4.46%) |
53.37 |
52.69 - 54.01 |
0.8176 times |
Tue 07 October 2025 |
55.77 (-0.55%) |
56.24 |
55.56 - 56.74 |
0.8804 times |
Mon 06 October 2025 |
56.08 (-1.13%) |
56.55 |
55.36 - 56.62 |
0.658 times |
Fri 03 October 2025 |
56.72 (3.41%) |
55.10 |
54.81 - 56.93 |
1.088 times |
Thu 02 October 2025 |
54.85 (-0.51%) |
54.71 |
53.66 - 55.08 |
0.6727 times |
Wed 01 October 2025 |
55.13 (4.1%) |
53.04 |
52.71 - 55.20 |
1.5249 times |
Weekly price and charts CbizInc Strong weekly Stock price targets for CbizInc CBZ are 51.39 and 52.36 | Weekly Target 1 | 50.59 | | Weekly Target 2 | 51.22 | | Weekly Target 3 | 51.563333333333 | | Weekly Target 4 | 52.19 | | Weekly Target 5 | 52.53 |
Weekly price and volumes for Cbiz Inc
| Date |
Closing |
Open |
Range |
Volume |
Mon 20 October 2025 |
51.84 (1.11%) |
51.53 |
50.94 - 51.91 |
0.1843 times |
Fri 17 October 2025 |
51.27 (-8.07%) |
53.37 |
50.78 - 55.57 |
1.0538 times |
Tue 07 October 2025 |
55.77 (-1.67%) |
56.55 |
55.36 - 56.74 |
0.2843 times |
Fri 03 October 2025 |
56.72 (7.85%) |
52.54 |
51.74 - 56.93 |
1.2754 times |
Fri 26 September 2025 |
52.59 (-2.21%) |
53.50 |
50.51 - 54.20 |
1.6417 times |
Fri 19 September 2025 |
53.78 (-3.43%) |
55.93 |
53.58 - 57.51 |
2.087 times |
Fri 12 September 2025 |
55.69 (-6.97%) |
59.63 |
55.59 - 59.93 |
1.315 times |
Fri 05 September 2025 |
59.86 (-7.25%) |
63.96 |
58.70 - 64.25 |
1.2162 times |
Fri 29 August 2025 |
64.54 (0%) |
64.51 |
63.91 - 64.90 |
0.1458 times |
Fri 29 August 2025 |
64.54 (-3.03%) |
66.52 |
63.91 - 66.52 |
0.7964 times |
Fri 22 August 2025 |
66.56 (6.72%) |
62.44 |
62.16 - 67.24 |
0.8878 times |
Monthly price and charts CbizInc Strong monthly Stock price targets for CbizInc CBZ are 48.24 and 54.39 | Monthly Target 1 | 47.03 | | Monthly Target 2 | 49.44 | | Monthly Target 3 | 53.183333333333 | | Monthly Target 4 | 55.59 | | Monthly Target 5 | 59.33 |
Monthly price and volumes Cbiz Inc
| Date |
Closing |
Open |
Range |
Volume |
Mon 20 October 2025 |
51.84 (-2.11%) |
53.04 |
50.78 - 56.93 |
0.5363 times |
Tue 30 September 2025 |
52.96 (-17.94%) |
63.96 |
50.51 - 64.25 |
1.7448 times |
Fri 29 August 2025 |
64.54 (5.6%) |
62.69 |
60.00 - 67.24 |
1.1545 times |
Thu 31 July 2025 |
61.12 (-14.77%) |
71.18 |
56.83 - 77.91 |
1.5638 times |
Mon 30 June 2025 |
71.71 (-0.73%) |
71.50 |
66.64 - 74.86 |
1.112 times |
Fri 30 May 2025 |
72.24 (6.08%) |
67.82 |
67.18 - 76.57 |
0.7957 times |
Wed 30 April 2025 |
68.10 (-10.23%) |
75.46 |
64.85 - 80.65 |
1.1172 times |
Mon 31 March 2025 |
75.86 (-2.96%) |
78.19 |
66.01 - 78.99 |
0.7991 times |
Fri 28 February 2025 |
78.17 (-8.9%) |
84.72 |
77.88 - 90.13 |
0.6656 times |
Fri 31 January 2025 |
85.81 (4.86%) |
82.00 |
80.09 - 86.73 |
0.5111 times |
Tue 31 December 2024 |
81.83 (-1.41%) |
81.00 |
77.14 - 83.43 |
0.5586 times |

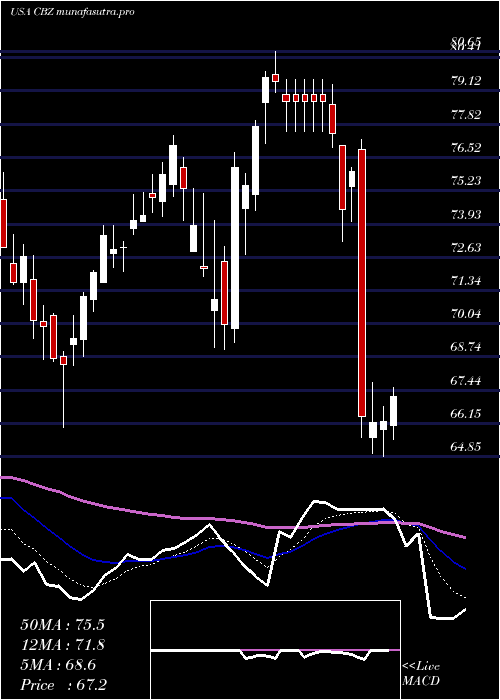
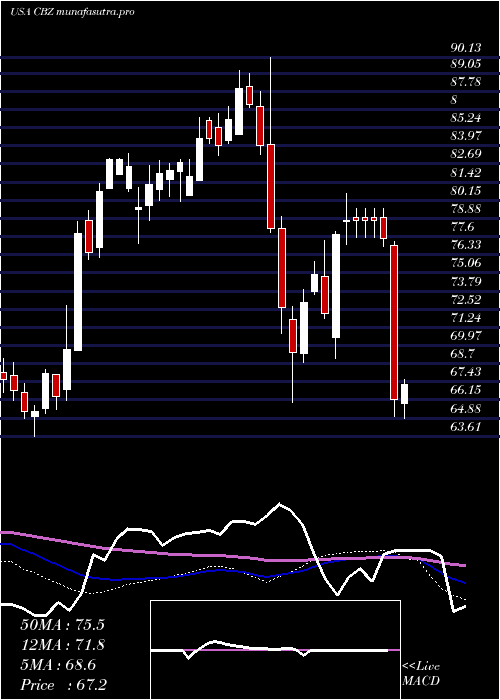
DMA SMA EMA moving averages of Cbiz Inc CBZ
DMA (daily moving average) of Cbiz Inc CBZ
| DMA period | DMA value | | 5 day DMA | 52.79 | | 12 day DMA | 54.06 | | 20 day DMA | 53.68 | | 35 day DMA | 56.08 | | 50 day DMA | 58.41 | | 100 day DMA | 65.08 | | 150 day DMA | 67.86 | | 200 day DMA | 71.53 | EMA (exponential moving average) of Cbiz Inc CBZ
| EMA period | EMA current | EMA prev | EMA prev2 | | 5 day EMA | 52.56 | 52.92 | 53.74 | | 12 day EMA | 53.5 | 53.8 | 54.26 | | 20 day EMA | 54.32 | 54.58 | 54.93 | | 35 day EMA | 56.3 | 56.56 | 56.87 | | 50 day EMA | 58.36 | 58.63 | 58.93 |
SMA (simple moving average) of Cbiz Inc CBZ
| SMA period | SMA current | SMA prev | SMA prev2 | | 5 day SMA | 52.79 | 53.08 | 53.98 | | 12 day SMA | 54.06 | 54.23 | 54.34 | | 20 day SMA | 53.68 | 53.93 | 54.14 | | 35 day SMA | 56.08 | 56.48 | 56.87 | | 50 day SMA | 58.41 | 58.61 | 58.84 | | 100 day SMA | 65.08 | 65.28 | 65.5 | | 150 day SMA | 67.86 | 67.97 | 68.1 | | 200 day SMA | 71.53 | 71.67 | 71.83 |
|
|
