CommunityBank CBU full analysis,charts,indicators,moving averages,SMA,DMA,EMA,ADX,MACD,RSICommunity Bank CBU WideScreen charts, DMA,SMA,EMA technical analysis, forecast prediction, by indicators ADX,MACD,RSI,CCI USA stock exchange
operates under Finance sector & deals in Major Banks
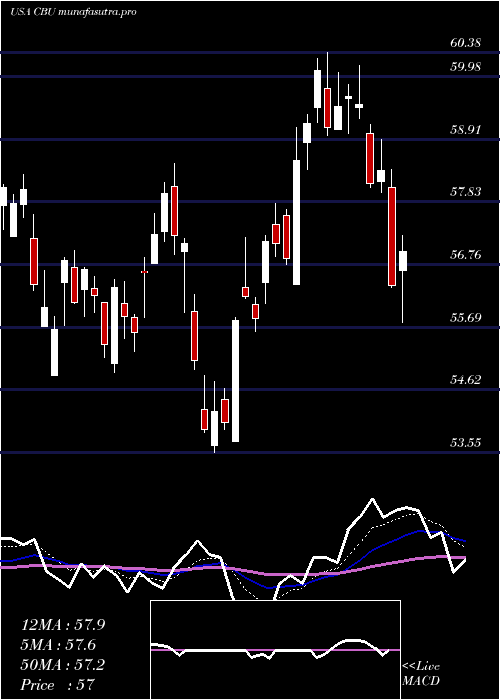
Daily price and charts and targets CommunityBank Strong Daily Stock price targets for CommunityBank CBU are 54.65 and 56.39 | Daily Target 1 | 54.14 | | Daily Target 2 | 55.16 | | Daily Target 3 | 55.88 | | Daily Target 4 | 56.9 | | Daily Target 5 | 57.62 |
Daily price and volume Community Bank
| Date |
Closing |
Open |
Range |
Volume |
Tue 21 October 2025 |
56.18 (0.25%) |
56.60 |
54.86 - 56.60 |
1.1275 times |
Mon 20 October 2025 |
56.04 (0.74%) |
55.90 |
55.89 - 56.65 |
1.0031 times |
Fri 17 October 2025 |
55.63 (1.13%) |
55.44 |
54.66 - 55.84 |
1.016 times |
Thu 16 October 2025 |
55.01 (-4.48%) |
57.12 |
54.60 - 57.23 |
1.3687 times |
Wed 15 October 2025 |
57.59 (-1.52%) |
58.62 |
57.32 - 58.71 |
0.7796 times |
Tue 14 October 2025 |
58.48 (4.08%) |
55.93 |
55.93 - 58.84 |
0.8216 times |
Mon 13 October 2025 |
56.19 (1.43%) |
56.09 |
55.11 - 56.40 |
0.7801 times |
Fri 10 October 2025 |
55.40 (-2.82%) |
57.26 |
55.26 - 58.05 |
1.2572 times |
Thu 09 October 2025 |
57.01 (-1.55%) |
57.83 |
56.61 - 58.16 |
1.077 times |
Wed 08 October 2025 |
57.91 (-0.53%) |
58.39 |
57.76 - 58.56 |
0.7693 times |
Tue 07 October 2025 |
58.22 (-1.34%) |
59.02 |
58.13 - 59.70 |
0.7576 times |
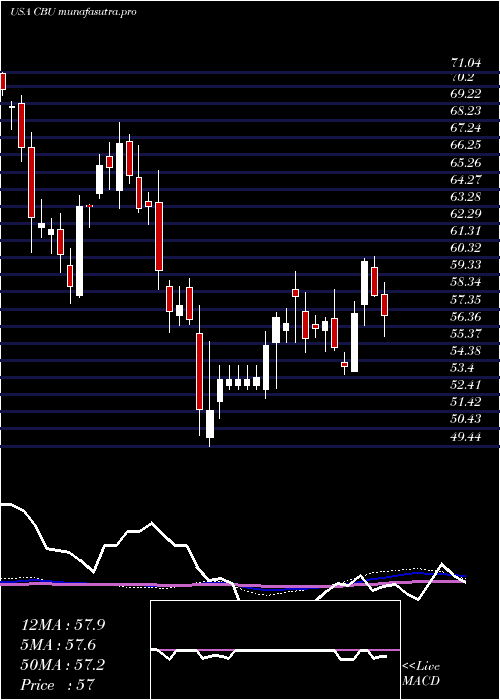
Weekly price and charts CommunityBank Strong weekly Stock price targets for CommunityBank CBU are 55.52 and 57.31 | Weekly Target 1 | 54.11 | | Weekly Target 2 | 55.14 | | Weekly Target 3 | 55.896666666667 | | Weekly Target 4 | 56.93 | | Weekly Target 5 | 57.69 |
Weekly price and volumes for Community Bank
| Date |
Closing |
Open |
Range |
Volume |
Tue 21 October 2025 |
56.18 (0.99%) |
55.90 |
54.86 - 56.65 |
0.4829 times |
Fri 17 October 2025 |
55.63 (0.42%) |
56.09 |
54.60 - 58.84 |
1.0803 times |
Fri 10 October 2025 |
55.40 (-5.72%) |
59.13 |
55.26 - 59.92 |
0.98 times |
Fri 03 October 2025 |
58.76 (-1.61%) |
59.70 |
57.23 - 59.73 |
0.8601 times |
Fri 26 September 2025 |
59.72 (-1.47%) |
60.32 |
59.21 - 61.08 |
0.95 times |
Fri 19 September 2025 |
60.61 (2.94%) |
58.95 |
56.64 - 62.45 |
2.8796 times |
Fri 12 September 2025 |
58.88 (-1.74%) |
60.02 |
58.51 - 60.45 |
0.8534 times |
Fri 05 September 2025 |
59.92 (0.05%) |
59.09 |
58.55 - 61.57 |
0.6429 times |
Fri 29 August 2025 |
59.89 (0%) |
60.69 |
59.80 - 61.31 |
0.1887 times |
Fri 29 August 2025 |
59.89 (-0.56%) |
59.98 |
59.80 - 61.78 |
1.082 times |
Fri 22 August 2025 |
60.23 (6.75%) |
56.35 |
56.19 - 60.66 |
1.1022 times |
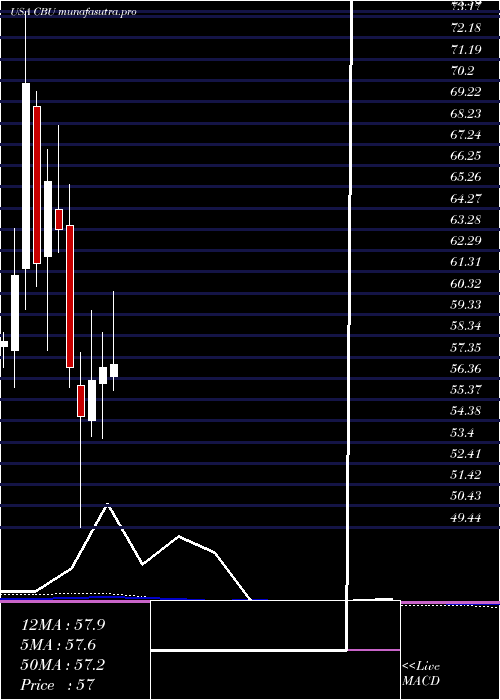
Monthly price and charts CommunityBank Strong monthly Stock price targets for CommunityBank CBU are 52.73 and 58.05 | Monthly Target 1 | 51.58 | | Monthly Target 2 | 53.88 | | Monthly Target 3 | 56.9 | | Monthly Target 4 | 59.2 | | Monthly Target 5 | 62.22 |
Monthly price and volumes Community Bank
| Date |
Closing |
Open |
Range |
Volume |
Tue 21 October 2025 |
56.18 (-4.2%) |
58.18 |
54.60 - 59.92 |
0.6382 times |
Tue 30 September 2025 |
58.64 (-2.09%) |
59.09 |
56.64 - 62.45 |
1.2165 times |
Fri 29 August 2025 |
59.89 (13.64%) |
51.98 |
51.12 - 61.78 |
1.3863 times |
Thu 31 July 2025 |
52.70 (-7.33%) |
56.43 |
52.51 - 60.38 |
1.224 times |
Mon 30 June 2025 |
56.87 (1.12%) |
56.11 |
53.55 - 58.48 |
0.723 times |
Fri 30 May 2025 |
56.24 (3.02%) |
54.42 |
53.64 - 59.52 |
0.794 times |
Wed 30 April 2025 |
54.59 (-3.99%) |
56.03 |
49.44 - 57.56 |
1.1663 times |
Mon 31 March 2025 |
56.86 (-10.16%) |
63.48 |
55.95 - 65.35 |
1.0423 times |
Fri 28 February 2025 |
63.29 (-3.42%) |
64.19 |
62.21 - 68.11 |
0.7187 times |
Fri 31 January 2025 |
65.53 (6.24%) |
62.00 |
57.67 - 67.00 |
1.0907 times |
Tue 31 December 2024 |
61.68 (-11.96%) |
69.01 |
60.62 - 69.69 |
0.7758 times |
DMA SMA EMA moving averages of Community Bank CBU
DMA (daily moving average) of Community Bank CBU
| DMA period | DMA value | | 5 day DMA | 56.09 | | 12 day DMA | 56.89 | | 20 day DMA | 57.72 | | 35 day DMA | 58.58 | | 50 day DMA | 58.7 | | 100 day DMA | 57.49 | | 150 day DMA | 56.78 | | 200 day DMA | 58.27 | EMA (exponential moving average) of Community Bank CBU
| EMA period | EMA current | EMA prev | EMA prev2 | | 5 day EMA | 56.2 | 56.21 | 56.29 | | 12 day EMA | 56.83 | 56.95 | 57.11 | | 20 day EMA | 57.38 | 57.51 | 57.66 | | 35 day EMA | 57.78 | 57.87 | 57.98 | | 50 day EMA | 58.16 | 58.24 | 58.33 |
SMA (simple moving average) of Community Bank CBU
| SMA period | SMA current | SMA prev | SMA prev2 | | 5 day SMA | 56.09 | 56.55 | 56.58 | | 12 day SMA | 56.89 | 57.1 | 57.26 | | 20 day SMA | 57.72 | 57.92 | 58.12 | | 35 day SMA | 58.58 | 58.67 | 58.78 | | 50 day SMA | 58.7 | 58.76 | 58.77 | | 100 day SMA | 57.49 | 57.49 | 57.5 | | 150 day SMA | 56.78 | 56.8 | 56.8 | | 200 day SMA | 58.27 | 58.3 | 58.33 |
|
|
