ColonyBankcorp CBAN full analysis,charts,indicators,moving averages,SMA,DMA,EMA,ADX,MACD,RSIColony Bankcorp CBAN WideScreen charts, DMA,SMA,EMA technical analysis, forecast prediction, by indicators ADX,MACD,RSI,CCI USA stock exchange
operates under Finance sector & deals in Major Banks
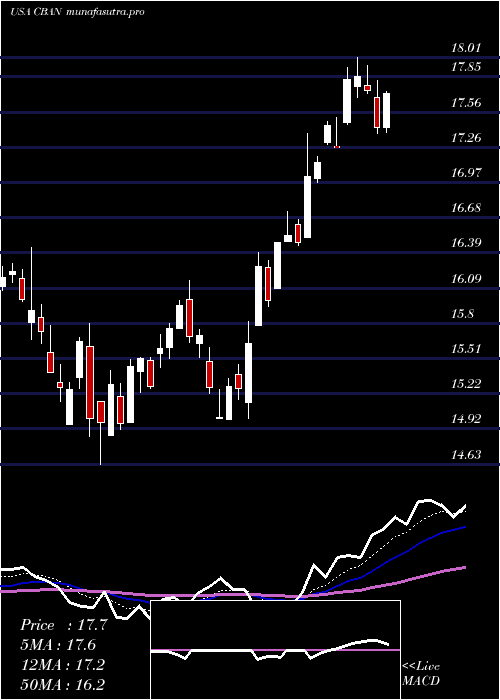
Daily price and charts and targets ColonyBankcorp Strong Daily Stock price targets for ColonyBankcorp CBAN are 17.14 and 17.56 | Daily Target 1 | 17.02 | | Daily Target 2 | 17.19 | | Daily Target 3 | 17.443333333333 | | Daily Target 4 | 17.61 | | Daily Target 5 | 17.86 |
Daily price and volume Colony Bankcorp
| Date |
Closing |
Open |
Range |
Volume |
Thu 04 December 2025 |
17.35 (-0.12%) |
17.35 |
17.28 - 17.70 |
1.7007 times |
Wed 03 December 2025 |
17.37 (2.24%) |
17.15 |
17.11 - 17.50 |
1.3141 times |
Tue 02 December 2025 |
16.99 (-1.56%) |
17.40 |
16.90 - 17.40 |
1.3063 times |
Mon 01 December 2025 |
17.26 (0.64%) |
17.25 |
17.18 - 17.46 |
0.6516 times |
Fri 28 November 2025 |
17.15 (0.88%) |
17.06 |
16.95 - 17.22 |
0.385 times |
Wed 26 November 2025 |
17.00 (-0.7%) |
17.03 |
17.00 - 17.18 |
0.6719 times |
Tue 25 November 2025 |
17.12 (2.27%) |
16.92 |
16.85 - 17.19 |
1.0366 times |
Mon 24 November 2025 |
16.74 (-0.48%) |
16.71 |
16.64 - 16.86 |
0.6656 times |
Fri 21 November 2025 |
16.82 (3.76%) |
16.29 |
16.29 - 16.95 |
1.5012 times |
Thu 20 November 2025 |
16.21 (0.31%) |
16.34 |
16.19 - 16.60 |
0.767 times |
Wed 19 November 2025 |
16.16 (-0.43%) |
16.28 |
16.11 - 16.34 |
0.901 times |
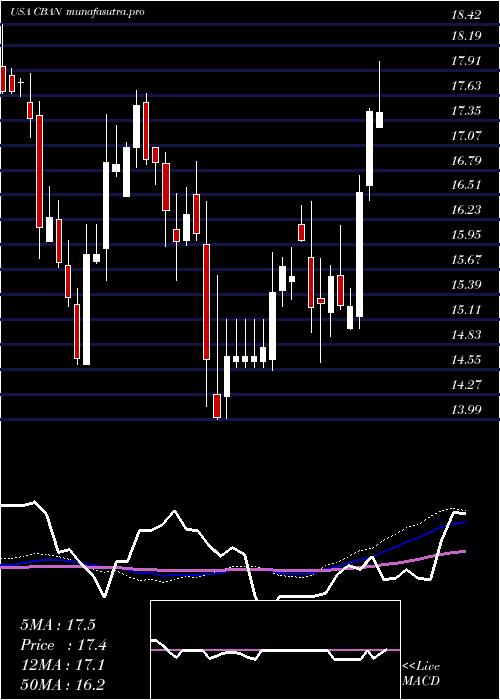
Weekly price and charts ColonyBankcorp Strong weekly Stock price targets for ColonyBankcorp CBAN are 17.13 and 17.93 | Weekly Target 1 | 16.52 | | Weekly Target 2 | 16.93 | | Weekly Target 3 | 17.316666666667 | | Weekly Target 4 | 17.73 | | Weekly Target 5 | 18.12 |
Weekly price and volumes for Colony Bankcorp
| Date |
Closing |
Open |
Range |
Volume |
Thu 04 December 2025 |
17.35 (1.17%) |
17.25 |
16.90 - 17.70 |
1.4282 times |
Fri 28 November 2025 |
17.15 (1.96%) |
16.71 |
16.64 - 17.22 |
0.7925 times |
Fri 21 November 2025 |
16.82 (1.88%) |
16.45 |
16.01 - 16.95 |
1.2666 times |
Fri 14 November 2025 |
16.51 (2.8%) |
16.13 |
16.00 - 16.56 |
0.9653 times |
Fri 07 November 2025 |
16.06 (0.44%) |
16.00 |
15.90 - 16.34 |
0.8766 times |
Fri 31 October 2025 |
15.99 (0%) |
16.00 |
15.93 - 16.13 |
0.2194 times |
Fri 31 October 2025 |
15.99 (-4.25%) |
16.74 |
15.81 - 16.90 |
1.657 times |
Fri 24 October 2025 |
16.70 (3.79%) |
16.17 |
16.17 - 16.77 |
0.9993 times |
Fri 17 October 2025 |
16.09 (0.19%) |
16.24 |
15.90 - 17.16 |
1.0557 times |
Fri 10 October 2025 |
16.06 (-4.4%) |
16.90 |
16.05 - 17.14 |
0.7394 times |
Fri 03 October 2025 |
16.80 (-4.82%) |
17.69 |
16.49 - 17.78 |
1.0689 times |
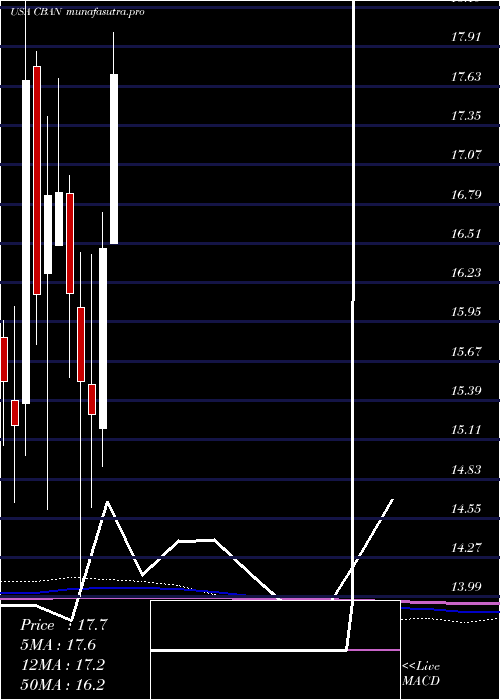
Monthly price and charts ColonyBankcorp Strong monthly Stock price targets for ColonyBankcorp CBAN are 17.13 and 17.93 | Monthly Target 1 | 16.52 | | Monthly Target 2 | 16.93 | | Monthly Target 3 | 17.316666666667 | | Monthly Target 4 | 17.73 | | Monthly Target 5 | 18.12 |
Monthly price and volumes Colony Bankcorp
| Date |
Closing |
Open |
Range |
Volume |
Thu 04 December 2025 |
17.35 (1.17%) |
17.25 |
16.90 - 17.70 |
0.2717 times |
Fri 28 November 2025 |
17.15 (7.25%) |
16.00 |
15.90 - 17.22 |
0.742 times |
Fri 31 October 2025 |
15.99 (-6%) |
16.89 |
15.81 - 17.16 |
0.9812 times |
Tue 30 September 2025 |
17.01 (-0.99%) |
17.06 |
16.89 - 18.41 |
1.1767 times |
Fri 29 August 2025 |
17.18 (4.82%) |
16.15 |
15.86 - 17.50 |
1.0181 times |
Thu 31 July 2025 |
16.39 (-0.49%) |
16.51 |
16.30 - 18.05 |
1.2233 times |
Mon 30 June 2025 |
16.47 (7.72%) |
15.19 |
14.92 - 16.73 |
0.8718 times |
Fri 30 May 2025 |
15.29 (-1.48%) |
15.50 |
14.63 - 16.43 |
0.9998 times |
Wed 30 April 2025 |
15.52 (-3.9%) |
16.05 |
13.99 - 16.44 |
1.1982 times |
Mon 31 March 2025 |
16.15 (-4.27%) |
16.86 |
15.55 - 16.99 |
1.5173 times |
Fri 28 February 2025 |
16.87 (0.12%) |
16.49 |
16.49 - 17.68 |
1.0932 times |
DMA SMA EMA moving averages of Colony Bankcorp CBAN
DMA (daily moving average) of Colony Bankcorp CBAN
| DMA period | DMA value | | 5 day DMA | 17.22 | | 12 day DMA | 16.87 | | 20 day DMA | 16.61 | | 35 day DMA | 16.46 | | 50 day DMA | 16.59 | | 100 day DMA | 16.79 | | 150 day DMA | 16.53 | | 200 day DMA | 16.33 | EMA (exponential moving average) of Colony Bankcorp CBAN
| EMA period | EMA current | EMA prev | EMA prev2 | | 5 day EMA | 17.21 | 17.14 | 17.02 | | 12 day EMA | 16.96 | 16.89 | 16.8 | | 20 day EMA | 16.79 | 16.73 | 16.66 | | 35 day EMA | 16.76 | 16.72 | 16.68 | | 50 day EMA | 16.76 | 16.74 | 16.71 |
SMA (simple moving average) of Colony Bankcorp CBAN
| SMA period | SMA current | SMA prev | SMA prev2 | | 5 day SMA | 17.22 | 17.15 | 17.1 | | 12 day SMA | 16.87 | 16.76 | 16.69 | | 20 day SMA | 16.61 | 16.56 | 16.5 | | 35 day SMA | 16.46 | 16.45 | 16.44 | | 50 day SMA | 16.59 | 16.6 | 16.61 | | 100 day SMA | 16.79 | 16.79 | 16.79 | | 150 day SMA | 16.53 | 16.52 | 16.51 | | 200 day SMA | 16.33 | 16.33 | 16.34 |
|
|
