CathayGeneral CATY full analysis,charts,indicators,moving averages,SMA,DMA,EMA,ADX,MACD,RSICathay General CATY WideScreen charts, DMA,SMA,EMA technical analysis, forecast prediction, by indicators ADX,MACD,RSI,CCI USA stock exchange
operates under Finance sector & deals in Major Banks
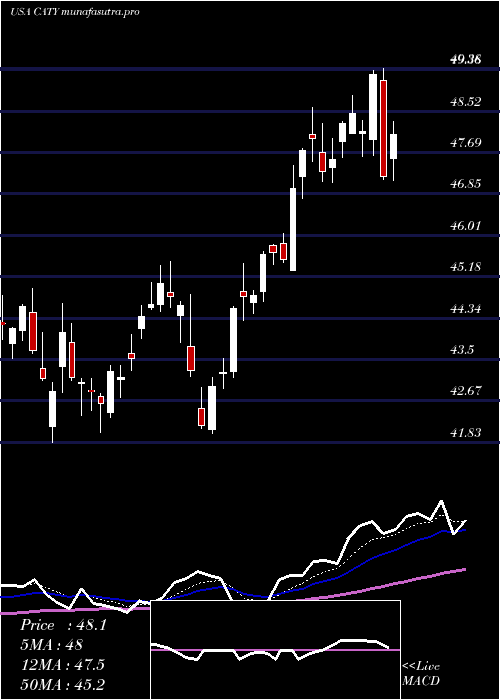
Daily price and charts and targets CathayGeneral Strong Daily Stock price targets for CathayGeneral CATY are 46.39 and 47.76 | Daily Target 1 | 45.27 | | Daily Target 2 | 46.14 | | Daily Target 3 | 46.643333333333 | | Daily Target 4 | 47.51 | | Daily Target 5 | 48.01 |
Daily price and volume Cathay General
| Date |
Closing |
Open |
Range |
Volume |
Mon 20 October 2025 |
47.00 (2.42%) |
46.07 |
45.78 - 47.15 |
0.7679 times |
Fri 17 October 2025 |
45.89 (1.01%) |
46.00 |
45.23 - 46.30 |
1.1237 times |
Thu 16 October 2025 |
45.43 (-7.04%) |
48.62 |
45.15 - 48.81 |
1.4703 times |
Wed 15 October 2025 |
48.87 (-0.93%) |
49.39 |
48.38 - 49.60 |
1.0846 times |
Tue 14 October 2025 |
49.33 (3.92%) |
46.97 |
46.95 - 49.73 |
1.1634 times |
Mon 13 October 2025 |
47.47 (2.44%) |
47.25 |
46.60 - 47.55 |
0.6784 times |
Fri 10 October 2025 |
46.34 (-5.45%) |
49.26 |
46.30 - 49.59 |
1.0994 times |
Thu 09 October 2025 |
49.01 (0.25%) |
48.66 |
48.32 - 49.26 |
0.9859 times |
Wed 08 October 2025 |
48.89 (0%) |
49.18 |
48.61 - 49.18 |
0.7766 times |
Tue 07 October 2025 |
48.89 (-0.29%) |
49.04 |
48.72 - 49.40 |
0.8498 times |
Mon 06 October 2025 |
49.03 (1.49%) |
48.67 |
48.45 - 49.76 |
0.9054 times |
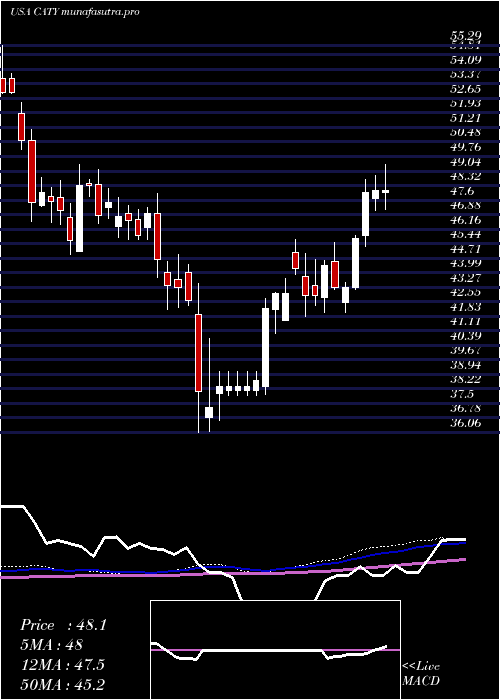
Weekly price and charts CathayGeneral Strong weekly Stock price targets for CathayGeneral CATY are 46.39 and 47.76 | Weekly Target 1 | 45.27 | | Weekly Target 2 | 46.14 | | Weekly Target 3 | 46.643333333333 | | Weekly Target 4 | 47.51 | | Weekly Target 5 | 48.01 |
Weekly price and volumes for Cathay General
| Date |
Closing |
Open |
Range |
Volume |
Mon 20 October 2025 |
47.00 (2.42%) |
46.07 |
45.78 - 47.15 |
0.1747 times |
Fri 17 October 2025 |
45.89 (-0.97%) |
47.25 |
45.15 - 49.73 |
1.2556 times |
Fri 10 October 2025 |
46.34 (-4.08%) |
48.67 |
46.30 - 49.76 |
1.0501 times |
Fri 03 October 2025 |
48.31 (-0.58%) |
48.64 |
47.23 - 48.70 |
0.8127 times |
Fri 26 September 2025 |
48.59 (-1.32%) |
49.27 |
48.01 - 49.69 |
0.9864 times |
Fri 19 September 2025 |
49.24 (0.22%) |
48.95 |
47.23 - 50.38 |
2.6648 times |
Fri 12 September 2025 |
49.13 (-1.03%) |
49.73 |
48.77 - 50.05 |
1.0617 times |
Fri 05 September 2025 |
49.64 (-0.54%) |
49.25 |
48.93 - 51.08 |
0.8614 times |
Fri 29 August 2025 |
49.91 (0%) |
49.87 |
49.47 - 50.35 |
0.2089 times |
Fri 29 August 2025 |
49.91 (-0.48%) |
49.96 |
49.28 - 50.55 |
0.9236 times |
Fri 22 August 2025 |
50.15 (6.03%) |
47.17 |
46.80 - 50.35 |
1.0092 times |
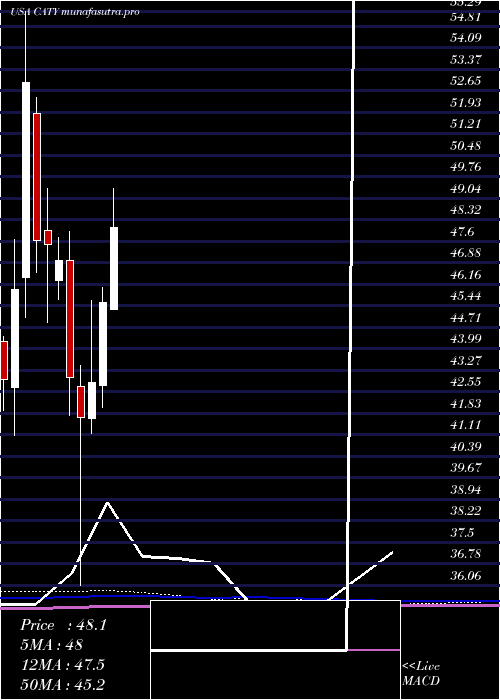
Monthly price and charts CathayGeneral Strong monthly Stock price targets for CathayGeneral CATY are 43.77 and 48.38 | Monthly Target 1 | 42.69 | | Monthly Target 2 | 44.85 | | Monthly Target 3 | 47.303333333333 | | Monthly Target 4 | 49.46 | | Monthly Target 5 | 51.91 |
Monthly price and volumes Cathay General
| Date |
Closing |
Open |
Range |
Volume |
Mon 20 October 2025 |
47.00 (-2.1%) |
47.72 |
45.15 - 49.76 |
0.5587 times |
Tue 30 September 2025 |
48.01 (-3.81%) |
49.25 |
47.23 - 51.08 |
1.114 times |
Fri 29 August 2025 |
49.91 (10.37%) |
44.71 |
43.66 - 50.55 |
0.9358 times |
Thu 31 July 2025 |
45.22 (-0.68%) |
45.30 |
45.06 - 49.38 |
1.2277 times |
Mon 30 June 2025 |
45.53 (6.23%) |
42.75 |
42.01 - 46.04 |
1.1816 times |
Fri 30 May 2025 |
42.86 (2.81%) |
41.64 |
41.14 - 45.62 |
0.8405 times |
Wed 30 April 2025 |
41.69 (-3.11%) |
42.74 |
36.06 - 43.44 |
1.2967 times |
Mon 31 March 2025 |
43.03 (-8.35%) |
46.95 |
41.74 - 47.93 |
1.1693 times |
Fri 28 February 2025 |
46.95 (-1.14%) |
46.28 |
45.63 - 47.71 |
0.7584 times |
Fri 31 January 2025 |
47.49 (-0.25%) |
47.96 |
44.87 - 49.37 |
0.9171 times |
Tue 31 December 2024 |
47.61 (-10.03%) |
51.90 |
46.56 - 52.43 |
0.734 times |
DMA SMA EMA moving averages of Cathay General CATY
DMA (daily moving average) of Cathay General CATY
| DMA period | DMA value | | 5 day DMA | 47.3 | | 12 day DMA | 47.87 | | 20 day DMA | 48.01 | | 35 day DMA | 48.58 | | 50 day DMA | 48.65 | | 100 day DMA | 47.17 | | 150 day DMA | 45.33 | | 200 day DMA | 45.61 | EMA (exponential moving average) of Cathay General CATY
| EMA period | EMA current | EMA prev | EMA prev2 | | 5 day EMA | 46.97 | 46.95 | 47.48 | | 12 day EMA | 47.54 | 47.64 | 47.96 | | 20 day EMA | 47.87 | 47.96 | 48.18 | | 35 day EMA | 48.07 | 48.13 | 48.26 | | 50 day EMA | 48.22 | 48.27 | 48.37 |
SMA (simple moving average) of Cathay General CATY
| SMA period | SMA current | SMA prev | SMA prev2 | | 5 day SMA | 47.3 | 47.4 | 47.49 | | 12 day SMA | 47.87 | 47.95 | 48.11 | | 20 day SMA | 48.01 | 48.11 | 48.27 | | 35 day SMA | 48.58 | 48.66 | 48.78 | | 50 day SMA | 48.65 | 48.62 | 48.61 | | 100 day SMA | 47.17 | 47.14 | 47.11 | | 150 day SMA | 45.33 | 45.31 | 45.28 | | 200 day SMA | 45.61 | 45.61 | 45.62 |
|
|
