CaterpillarInc CAT full analysis,charts,indicators,moving averages,SMA,DMA,EMA,ADX,MACD,RSICaterpillar Inc CAT WideScreen charts, DMA,SMA,EMA technical analysis, forecast prediction, by indicators ADX,MACD,RSI,CCI USA stock exchange
operates under Capital Goods sector & deals in Construction Ag Equipment Trucks
Daily price and charts and targets CaterpillarInc Strong Daily Stock price targets for CaterpillarInc CAT are 593.1 and 608.82 | Daily Target 1 | 580.59 | | Daily Target 2 | 589.89 | | Daily Target 3 | 596.30666666667 | | Daily Target 4 | 605.61 | | Daily Target 5 | 612.03 |
Daily price and volume Caterpillar Inc
| Date |
Closing |
Open |
Range |
Volume |
Thu 04 December 2025 |
599.20 (1.3%) |
592.00 |
587.00 - 602.72 |
0.5525 times |
Wed 03 December 2025 |
591.49 (1.51%) |
581.40 |
562.21 - 593.24 |
1.2007 times |
Tue 02 December 2025 |
582.68 (2.57%) |
570.00 |
568.90 - 585.56 |
0.7495 times |
Mon 01 December 2025 |
568.06 (-1.34%) |
570.41 |
567.00 - 575.59 |
0.8321 times |
Fri 28 November 2025 |
575.76 (0.38%) |
573.79 |
572.40 - 577.36 |
0.4808 times |
Wed 26 November 2025 |
573.59 (1.24%) |
568.09 |
560.00 - 574.88 |
0.4841 times |
Tue 25 November 2025 |
566.58 (1.25%) |
560.70 |
547.55 - 567.14 |
0.62 times |
Mon 24 November 2025 |
559.60 (1.67%) |
552.13 |
550.67 - 565.74 |
2.195 times |
Fri 21 November 2025 |
550.43 (0.79%) |
545.82 |
537.08 - 554.99 |
1.3781 times |
Thu 20 November 2025 |
546.13 (-1.26%) |
565.95 |
541.00 - 568.87 |
1.5071 times |
Wed 19 November 2025 |
553.11 (1.14%) |
550.00 |
547.64 - 560.91 |
0.8872 times |
Weekly price and charts CaterpillarInc Strong weekly Stock price targets for CaterpillarInc CAT are 580.71 and 621.22 | Weekly Target 1 | 547.53 | | Weekly Target 2 | 573.37 | | Weekly Target 3 | 588.04333333333 | | Weekly Target 4 | 613.88 | | Weekly Target 5 | 628.55 |
Weekly price and volumes for Caterpillar Inc
| Date |
Closing |
Open |
Range |
Volume |
Thu 04 December 2025 |
599.20 (4.07%) |
570.41 |
562.21 - 602.72 |
0.6262 times |
Fri 28 November 2025 |
575.76 (4.6%) |
552.13 |
547.55 - 577.36 |
0.7098 times |
Fri 21 November 2025 |
550.43 (-0.65%) |
552.59 |
537.08 - 568.87 |
1.0503 times |
Fri 14 November 2025 |
554.03 (-1.6%) |
570.00 |
541.00 - 581.27 |
0.9623 times |
Fri 07 November 2025 |
563.05 (-2.46%) |
566.33 |
545.20 - 583.99 |
0.7539 times |
Fri 31 October 2025 |
577.26 (0%) |
584.03 |
571.35 - 587.05 |
0.2635 times |
Fri 31 October 2025 |
577.26 (10.43%) |
527.05 |
521.43 - 596.21 |
1.5736 times |
Fri 24 October 2025 |
522.73 (-0.83%) |
529.56 |
510.21 - 534.20 |
1.2038 times |
Fri 17 October 2025 |
527.08 (7.28%) |
502.15 |
495.45 - 544.99 |
1.5768 times |
Fri 10 October 2025 |
491.30 (-1.32%) |
498.09 |
483.55 - 511.50 |
1.2798 times |
Fri 03 October 2025 |
497.85 (6.89%) |
468.08 |
467.46 - 504.48 |
1.1273 times |
Monthly price and charts CaterpillarInc Strong monthly Stock price targets for CaterpillarInc CAT are 580.71 and 621.22 | Monthly Target 1 | 547.53 | | Monthly Target 2 | 573.37 | | Monthly Target 3 | 588.04333333333 | | Monthly Target 4 | 613.88 | | Monthly Target 5 | 628.55 |
Monthly price and volumes Caterpillar Inc
| Date |
Closing |
Open |
Range |
Volume |
Thu 04 December 2025 |
599.20 (4.07%) |
570.41 |
562.21 - 602.72 |
0.1338 times |
Fri 28 November 2025 |
575.76 (-0.26%) |
566.33 |
537.08 - 583.99 |
0.7429 times |
Fri 31 October 2025 |
577.26 (20.98%) |
474.01 |
471.14 - 596.21 |
1.4027 times |
Tue 30 September 2025 |
477.15 (13.87%) |
413.91 |
410.52 - 485.34 |
1.0801 times |
Fri 29 August 2025 |
419.04 (-4.33%) |
426.97 |
405.46 - 439.74 |
1.2925 times |
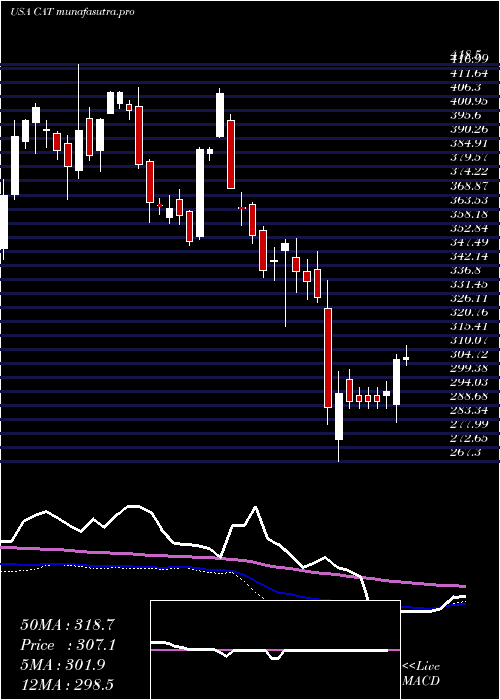
Thu 31 July 2025 |
438.02 (12.83%) |
386.59 |
384.25 - 441.15 |
1.0882 times |
Mon 30 June 2025 |
388.21 (11.54%) |
346.47 |
339.50 - 389.15 |
0.9101 times |
Fri 30 May 2025 |
348.03 (12.53%) |
311.38 |
311.02 - 355.33 |
1.0038 times |
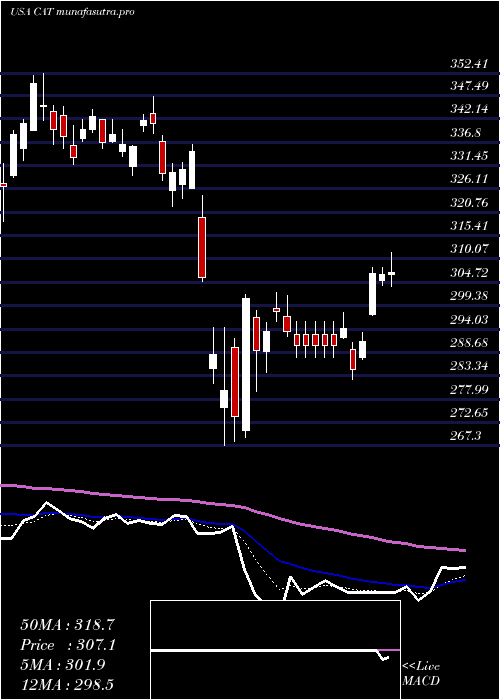
Wed 30 April 2025 |
309.27 (-6.22%) |
327.01 |
267.30 - 336.35 |
1.3515 times |
Mon 31 March 2025 |
329.80 (-4.11%) |
347.63 |
318.68 - 352.41 |
0.9944 times |
Fri 28 February 2025 |
343.95 (-7.4%) |
364.14 |
336.23 - 369.66 |
0.9232 times |

DMA SMA EMA moving averages of Caterpillar Inc CAT
DMA (daily moving average) of Caterpillar Inc CAT
| DMA period | DMA value | | 5 day DMA | 583.44 | | 12 day DMA | 567.79 | | 20 day DMA | 565.89 | | 35 day DMA | 556.86 | | 50 day DMA | 537.6 | | 100 day DMA | 483.09 | | 150 day DMA | 442.2 | | 200 day DMA | 411.45 | EMA (exponential moving average) of Caterpillar Inc CAT
| EMA period | EMA current | EMA prev | EMA prev2 | | 5 day EMA | 585.69 | 578.93 | 572.65 | | 12 day EMA | 574.27 | 569.74 | 565.79 | | 20 day EMA | 566.54 | 563.1 | 560.11 | | 35 day EMA | 550.47 | 547.6 | 545.02 | | 50 day EMA | 536.66 | 534.11 | 531.77 |
SMA (simple moving average) of Caterpillar Inc CAT
| SMA period | SMA current | SMA prev | SMA prev2 | | 5 day SMA | 583.44 | 578.32 | 573.33 | | 12 day SMA | 567.79 | 563.86 | 560.74 | | 20 day SMA | 565.89 | 564.39 | 562.19 | | 35 day SMA | 556.86 | 555 | 553.17 | | 50 day SMA | 537.6 | 535.01 | 532.6 | | 100 day SMA | 483.09 | 481.15 | 479.29 | | 150 day SMA | 442.2 | 440.27 | 438.37 | | 200 day SMA | 411.45 | 410.22 | 409.03 |
|
|
