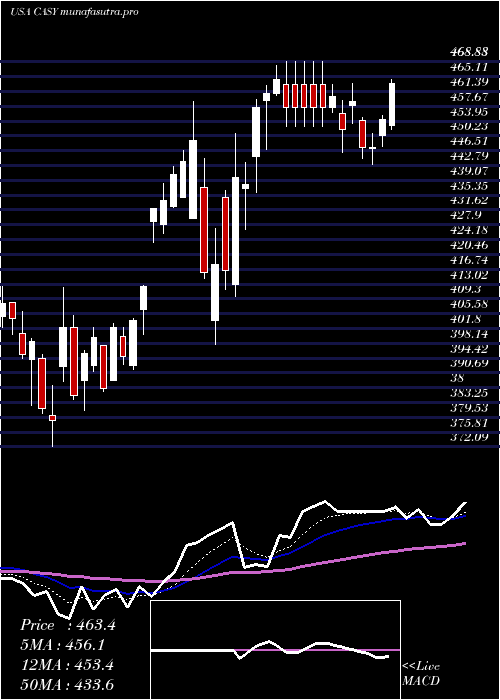
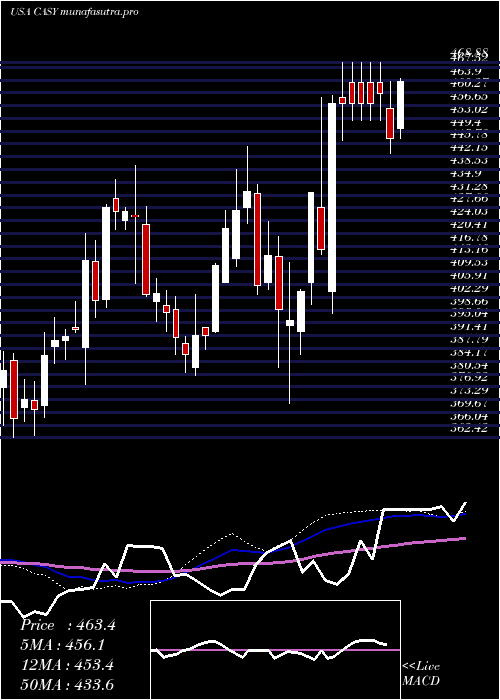
CaseysGeneral CASY full analysis,charts,indicators,moving averages,SMA,DMA,EMA,ADX,MACD,RSICaseys General CASY WideScreen charts, DMA,SMA,EMA technical analysis, forecast prediction, by indicators ADX,MACD,RSI,CCI USA stock exchange
operates under Consumer Durables sector & deals in Automotive Aftermarket
Daily price and charts and targets CaseysGeneral Strong Daily Stock price targets for CaseysGeneral CASY are 559.12 and 569.42 | Daily Target 1 | 550.9 | | Daily Target 2 | 557.03 | | Daily Target 3 | 561.20333333333 | | Daily Target 4 | 567.33 | | Daily Target 5 | 571.5 |
Daily price and volume Caseys General
| Date |
Closing |
Open |
Range |
Volume |
Thu 04 December 2025 |
563.15 (1.41%) |
555.30 |
555.08 - 565.38 |
1.3175 times |
Wed 03 December 2025 |
555.30 (-2.03%) |
562.80 |
554.09 - 570.00 |
0.8294 times |
Tue 02 December 2025 |
566.81 (-0.41%) |
572.88 |
564.85 - 572.88 |
0.7718 times |
Mon 01 December 2025 |
569.13 (-0.23%) |
572.39 |
565.00 - 573.59 |
0.9717 times |
Fri 28 November 2025 |
570.46 (-0.13%) |
570.99 |
568.23 - 573.76 |
0.3653 times |
Wed 26 November 2025 |
571.18 (1.02%) |
565.63 |
563.51 - 572.75 |
0.8566 times |
Tue 25 November 2025 |
565.43 (4.56%) |
544.48 |
542.00 - 566.03 |
1.1158 times |
Mon 24 November 2025 |
540.79 (-3.48%) |
558.37 |
539.51 - 560.55 |
1.4658 times |
Fri 21 November 2025 |
560.30 (1.64%) |
551.26 |
549.59 - 564.61 |
1.3629 times |
Thu 20 November 2025 |
551.24 (-0.98%) |
558.91 |
545.88 - 561.34 |
0.9431 times |
Wed 19 November 2025 |
556.71 (1.53%) |
547.64 |
547.64 - 558.88 |
0.9843 times |
Weekly price and charts CaseysGeneral Strong weekly Stock price targets for CaseysGeneral CASY are 548.87 and 568.37 | Weekly Target 1 | 544.11 | | Weekly Target 2 | 553.63 | | Weekly Target 3 | 563.61 | | Weekly Target 4 | 573.13 | | Weekly Target 5 | 583.11 |
Weekly price and volumes for Caseys General
| Date |
Closing |
Open |
Range |
Volume |
Thu 04 December 2025 |
563.15 (-1.28%) |
572.39 |
554.09 - 573.59 |
0.9037 times |
Fri 28 November 2025 |
570.46 (1.81%) |
558.37 |
539.51 - 573.76 |
0.8835 times |
Fri 21 November 2025 |
560.30 (4.11%) |
539.42 |
535.06 - 564.61 |
1.32 times |
Fri 14 November 2025 |
538.19 (0.87%) |
533.76 |
523.14 - 546.79 |
0.9611 times |
Fri 07 November 2025 |
533.57 (3.97%) |
512.37 |
511.32 - 534.97 |
0.9286 times |
Fri 31 October 2025 |
513.19 (0%) |
512.70 |
497.38 - 515.81 |
0.3885 times |
Fri 31 October 2025 |
513.19 (-3.38%) |
530.65 |
497.38 - 540.00 |
1.2828 times |
Fri 24 October 2025 |
531.14 (-6.33%) |
564.57 |
528.62 - 565.99 |
1.2407 times |
Fri 17 October 2025 |
567.05 (1.86%) |
557.61 |
555.82 - 572.18 |
1.1118 times |
Fri 10 October 2025 |
556.67 (-1.9%) |
565.45 |
546.49 - 566.37 |
0.9794 times |
Fri 03 October 2025 |
567.48 (3.64%) |
548.84 |
545.03 - 569.34 |
0.9421 times |
Monthly price and charts CaseysGeneral Strong monthly Stock price targets for CaseysGeneral CASY are 548.87 and 568.37 | Monthly Target 1 | 544.11 | | Monthly Target 2 | 553.63 | | Monthly Target 3 | 563.61 | | Monthly Target 4 | 573.13 | | Monthly Target 5 | 583.11 |
Monthly price and volumes Caseys General
| Date |
Closing |
Open |
Range |
Volume |
Thu 04 December 2025 |
563.15 (-1.28%) |
572.39 |
554.09 - 573.59 |
0.168 times |
Fri 28 November 2025 |
570.46 (11.16%) |
512.37 |
511.32 - 573.76 |
0.7609 times |
Fri 31 October 2025 |
513.19 (-9.22%) |
564.09 |
497.38 - 572.18 |
1.0288 times |
Tue 30 September 2025 |
565.32 (14.32%) |
490.89 |
490.50 - 571.57 |
1.4187 times |
Fri 29 August 2025 |
494.52 (-4.92%) |
519.38 |
490.00 - 524.52 |
0.6982 times |
Thu 31 July 2025 |
520.13 (1.93%) |
508.01 |
504.49 - 531.24 |
0.9617 times |
Mon 30 June 2025 |
510.27 (16.56%) |
436.51 |
433.16 - 514.32 |
1.4867 times |
Fri 30 May 2025 |
437.76 (-5.37%) |
460.54 |
430.00 - 474.97 |
1.1458 times |
Wed 30 April 2025 |
462.59 (6.58%) |
432.43 |
397.80 - 468.88 |
1.2851 times |
Mon 31 March 2025 |
434.04 (4.79%) |
413.85 |
372.09 - 438.23 |
1.0462 times |
Fri 28 February 2025 |
414.21 (-1.79%) |
413.19 |
403.10 - 445.17 |
0.8487 times |

DMA SMA EMA moving averages of Caseys General CASY
DMA (daily moving average) of Caseys General CASY
| DMA period | DMA value | | 5 day DMA | 564.97 | | 12 day DMA | 559.9 | | 20 day DMA | 549.68 | | 35 day DMA | 543.84 | | 50 day DMA | 548.13 | | 100 day DMA | 534.62 | | 150 day DMA | 515.37 | | 200 day DMA | 493.17 | EMA (exponential moving average) of Caseys General CASY
| EMA period | EMA current | EMA prev | EMA prev2 | | 5 day EMA | 562.56 | 562.26 | 565.74 | | 12 day EMA | 558.25 | 557.36 | 557.73 | | 20 day EMA | 553.52 | 552.51 | 552.22 | | 35 day EMA | 551.64 | 550.96 | 550.7 | | 50 day EMA | 549.7 | 549.15 | 548.9 |
SMA (simple moving average) of Caseys General CASY
| SMA period | SMA current | SMA prev | SMA prev2 | | 5 day SMA | 564.97 | 566.58 | 568.6 | | 12 day SMA | 559.9 | 557.67 | 556.24 | | 20 day SMA | 549.68 | 547.8 | 546.18 | | 35 day SMA | 543.84 | 543.87 | 544.04 | | 50 day SMA | 548.13 | 547.81 | 547.73 | | 100 day SMA | 534.62 | 534.16 | 533.84 | | 150 day SMA | 515.37 | 514.69 | 514.08 | | 200 day SMA | 493.17 | 492.48 | 491.87 |
|
|
